Content Marketing Budget Benchmarks by Company Size
Different company sizes need vastly different content budgets and approaches.

Two flagship surveys measured overall marketing budgets for roughly the same period and landed on different numbers: Gartner's 2026 figure puts total marketing spend at 7.8% of revenue, while the CMO Survey and Deloitte's 2025 data puts it somewhat higher. Neither is wrong; they sampled different populations, one skewed toward large enterprises, the other pulling from a broader mix of U.S. firms across every size tier. A marketing leader who grabs whichever number shows up first in a Google search and treats it as gospel has already miscalibrated the entire budget conversation before writing a single line item.
Averages flatten the exact structural differences that make a benchmark useful in the first place. What an early-stage startup should spend on content and what a $500 million enterprise should spend on content are different questions entirely, shaped by different constraints, different competitive sets, and different definitions of what "content" even means. This piece works through the benchmarks by size, small business through mid-market to enterprise, because size is the lens that makes any of these numbers actionable instead of decorative.
How content marketing's share of the overall budget has grown, and what that baseline looks like in practice
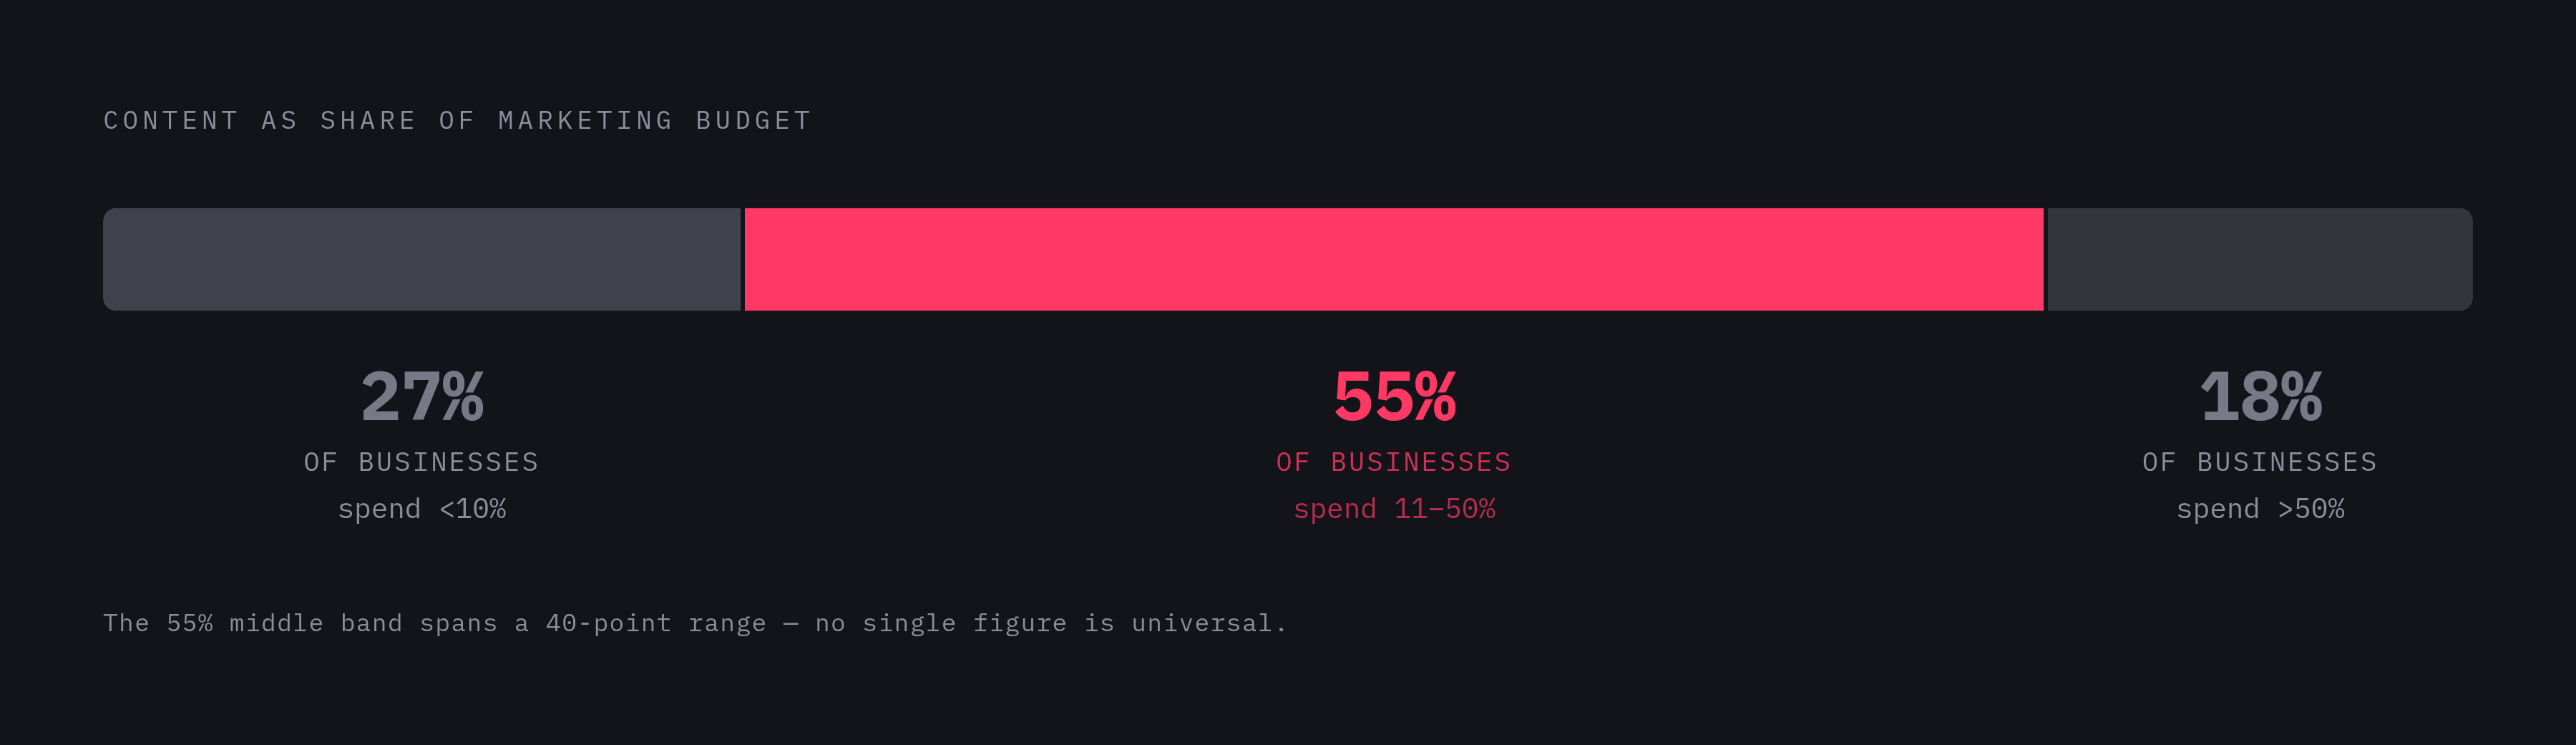
Content marketing now claims 26% of total marketing spend in 2026. That sounds like a tidy, quotable stat until someone asks the obvious follow-up: 26% of what?
Total marketing budgets range from roughly 7% to 12% of revenue depending on company type, so 26% applied to two wildly different bases produces two wildly different dollar figures. A company earning $2 million a year and a company earning $200 million a year can both report "26% of marketing budget goes to content" and be describing situations that share almost nothing operationally. That's the trap of citing a percentage without the base it's a percentage of, and it's the first thing to check before quoting any number in this piece back at a boss.
The distribution underneath the headline number tells its own story: roughly 55% of businesses put between 11% and 50% of their marketing budget into content, 27% spend less than 10%, and 18% spend more than half. A wide scatter like that is the first clue that no single percentage functions as a prescription for everyone reading it.
Here's the part worth taking a position on: the 26% figure and the "content and SEO" figure of 10% to 15% from Gartner's 2025 data measure different things, and treating them interchangeably is how budget conversations go sideways. The narrower number counts a line item; the broader one counts production, distribution, the people and tools behind it, and sometimes the martech layer underneath. Know which scope your own budget is actually measuring before benchmarking against anyone else's number, because skipping that step is how the comparison becomes meaningless.
Small business benchmarks: what lean investment looks like and when it becomes underinvestment
Small businesses, generally under $10 million in revenue, allocate 15.6% of total budget to marketing, the highest rate of any size tier. A brand with no existing awareness has to buy its way into relevance, and that costs proportionally more than defending ground already held.
Run the numbers and the dollar figure gets small fast. Using the 7% to 12% of revenue framework with a 25% to 30% content share, a business pulling in $500,000 a year works with something like a modest monthly budget for content: a blog, some social posts, an email newsletter, usually run by a lean team or a couple of freelancers rather than anything resembling a department.
The old assumptions about what that money buys are already out of date, though. About 51% of small businesses report no extra cost from content marketing because they use AI tools, which means a thousand dollars a month buys meaningfully more output than it did five years ago. The labor-intensive parts of drafting and editing now compete with tools that do a chunk of that work for the cost of a subscription instead of a salary.
Roughly 49% of small businesses planned to increase marketing budgets in 2025, while only 16% planned to cut, which tells you where most operators think the real risk sits. Underinvestment is the failure mode that actually costs small businesses growth. A business that spends its full allocation on content that publishes twice and stops is worse off than one spending less but never missing a week. At this size, consistency matters more than the percentage benchmark; a gap in execution costs more than a gap in dollars.
Mid-market benchmarks: moving from scrappy to systematic without overspending on complexity
Companies in the lower mid-market range allocate 12.2% of total budget to marketing; that falls to 10.2% for the $26 million to $99 million band. The percentage drops as revenue climbs, but don't mistake a shrinking percentage for shrinking dollars, since absolute spend rises sharply even as the ratio comes down, exactly what you'd expect from a business that's outgrown its founding scrappiness but hasn't hit enterprise scale yet.
Inside that marketing budget, content and brand activities, creation, SEO, PR, social, typically claim a meaningful share for B2B mid-market firms. A useful anchor: the median annual B2B content budget for companies with 50 to 500 employees reaches $185,000 in 2026, which lines up with the $5,001 to $10,000 monthly band where mid-market teams tend to cluster.
The machinery behind the number changes as much as the number itself. At this stage, how teams are structured and how spend is tracked tends to evolve alongside the growing budget, because the operation has outgrown its earliest arrangements.
Call this the mid-market trap: a company that grows revenue into this tier but keeps spending like it's still in the first one. Running a freelancer-only model with no strategy layer, against competitors who have both, is underinvesting in a way that never shows up in a percentage comparison. It shows up six months later as lost search rankings, stalled pipeline, and a competitor's name coming up in deals the company used to win uncontested. The fix requires producing at the cadence mid-market competition demands without paying full-service agency rates for the privilege, which is precisely where strategy-first, AI-assisted production earns whatever premium it charges.
Enterprise benchmarks: why large budgets don't automatically mean efficient content investment
Enterprise organizations, generally large-headcount organizations with substantial revenue, run marketing at a lower percentage of revenue than smaller firms; Gartner's 7.8% figure for 2026 is most representative of this cohort. Lower percentage, vastly larger absolute number, and at this scale the content budget funds things smaller tiers simply cannot touch: dedicated content teams, full martech stacks, high-production video, experiential activations at trade shows and events.
That last category deserves a beat. About 88% of enterprise teams allocated budget to experiential marketing in 2025, against 78% of B2B marketers overall, and that gap says something real: enterprise "content strategy" extends well past what a small business would even categorize as content. A branded activation booth at a conference is content marketing in the same sense a blog post is, just with a very different production budget strapped to it.
Here's where the enterprise story turns genuinely counterintuitive, and it's the position worth planting a flag on: bigger budgets do not mean more efficient budgets, and at the enterprise tier the two are often inversely related. Gartner finds 59% of CMOs say current budgets are insufficient to execute their strategy, even as martech (22%), labor (22%), and agencies (21%) eat most of the pie alongside paid media's 31% share. Content competes with all of that for whatever's left, and what's left is smaller than the headline number suggests.
The classic failure mode is a seven-figure content budget that takes six weeks to turn around a single asset because of layered approvals, handoffs between three agencies, and a martech stack nobody fully understands. A large share of B2B organizations have a dedicated content marketing team or person, according to CMI research. Having the team was never the achievement; the achievement is building one structured to move fast enough to justify what it costs, and plenty of enterprise operations never clear that bar no matter how large the line item gets.
How B2B vs. B2C orientation reshapes the benchmarks at every size tier
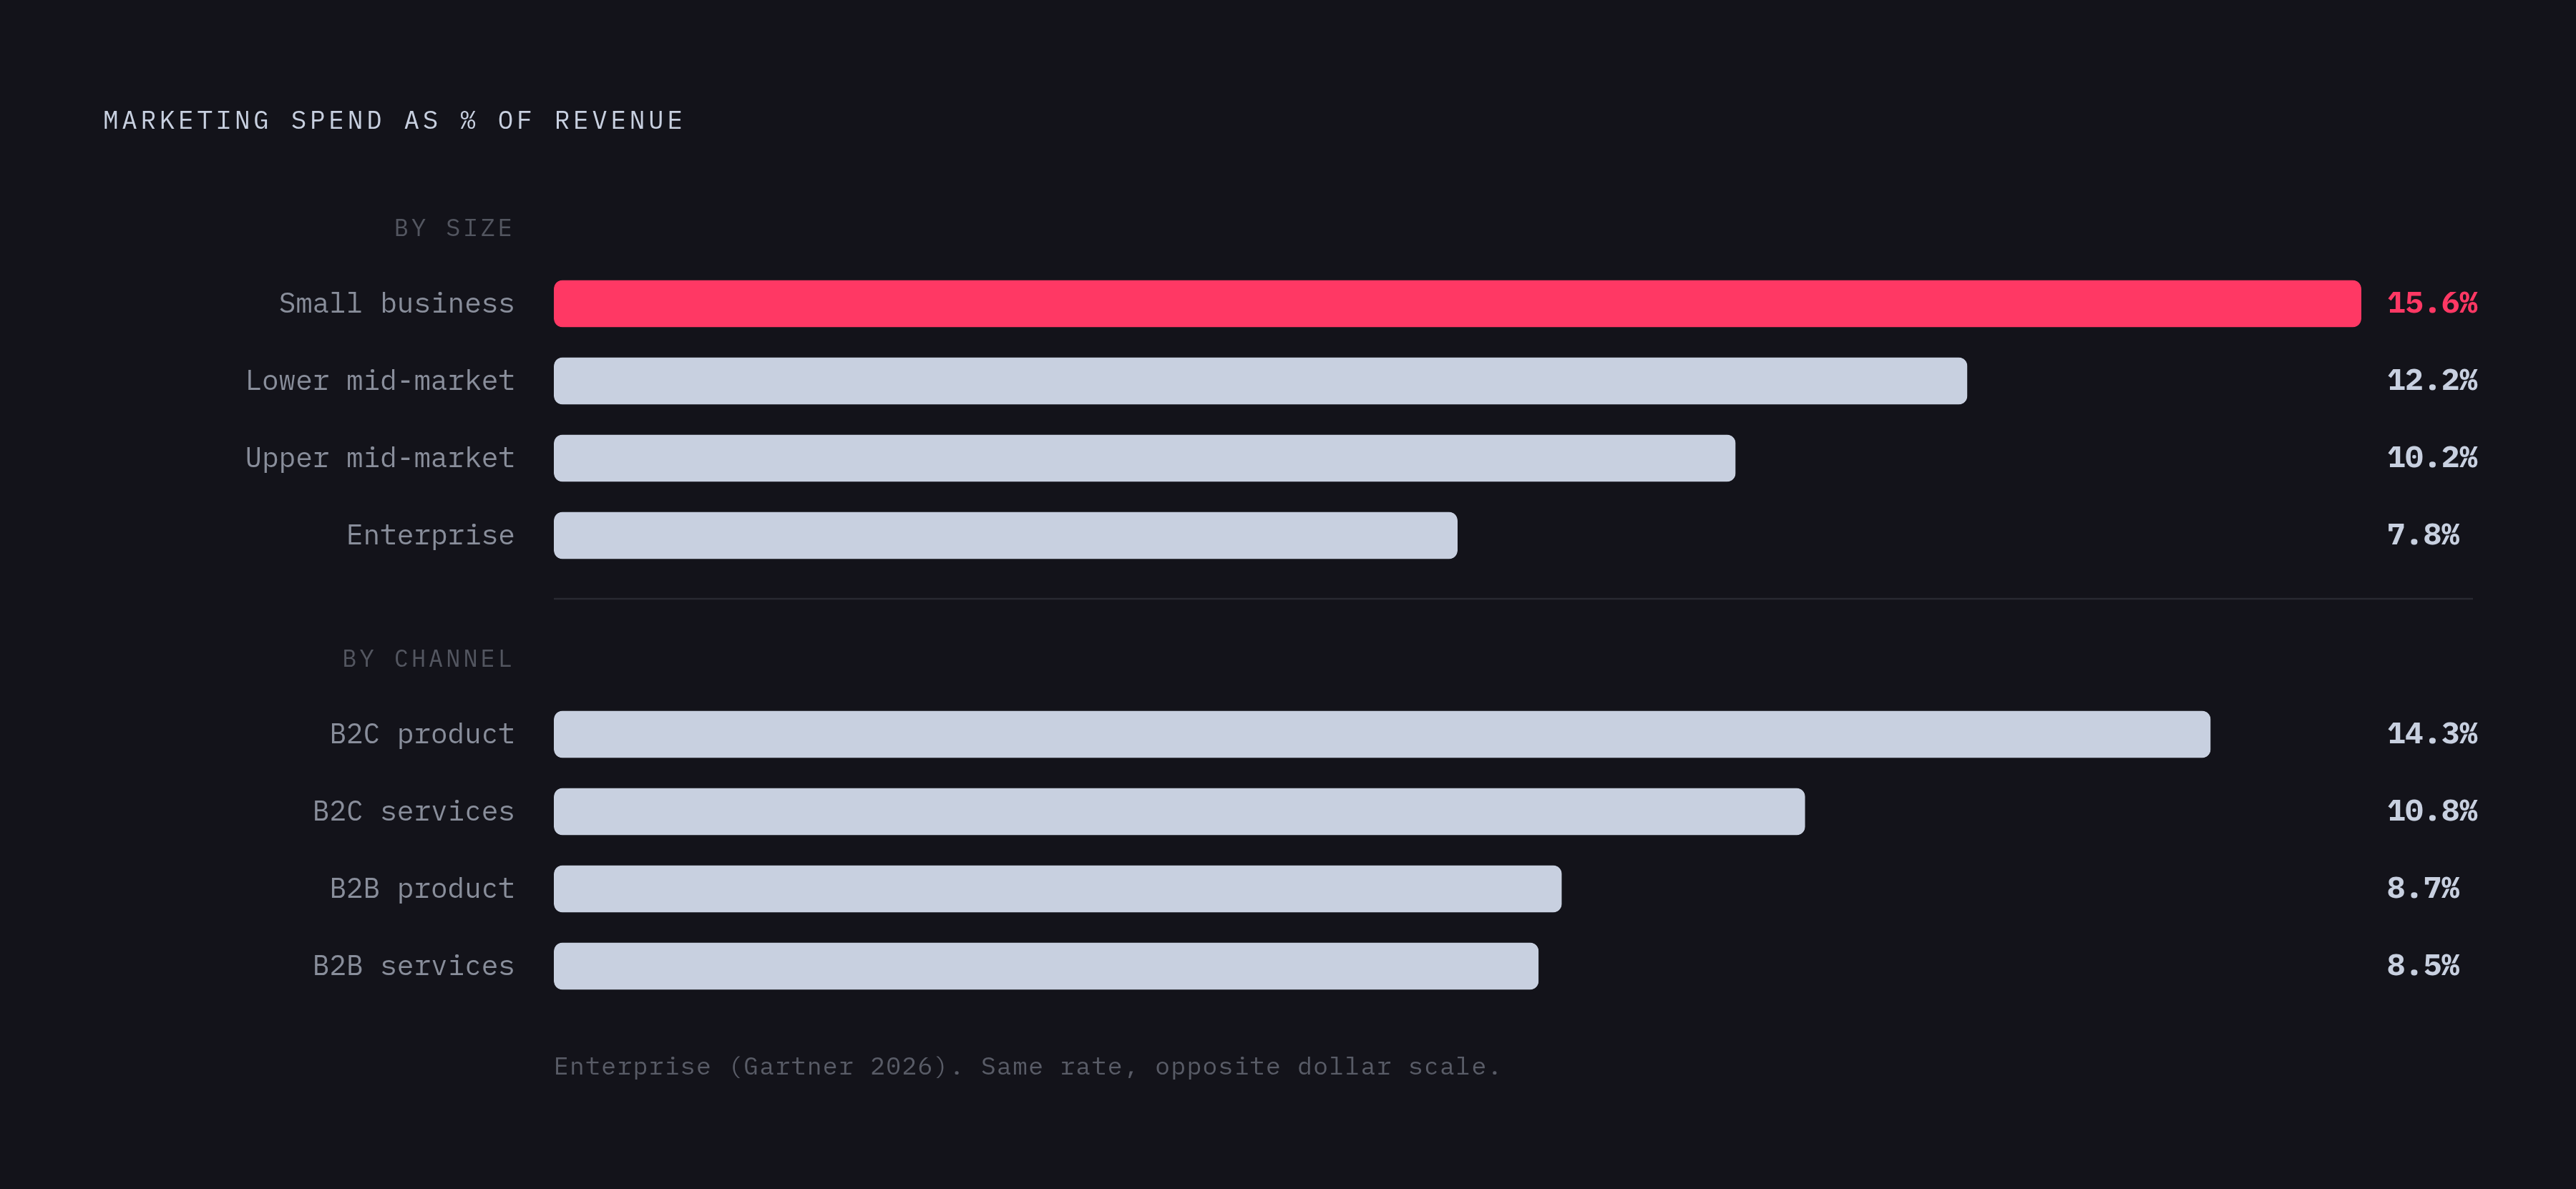
Business model changes the math as much as company size does, and ignoring it produces the same miscalibration as picking the wrong revenue tier. B2C organizations spend a larger share of revenue on marketing overall: 14.3% for B2C product companies and 10.8% for B2C services, against 8.7% for B2B product and 8.5% for B2B services.
Flip to content specifically, though, and the picture inverts. Content plays a proportionally bigger role in B2B, because B2B sales cycles run longer, involve more decision-makers, and depend on the kind of trust-building content is built to do. In B2C, content often supports a purchase decision made in minutes; in B2B, content is frequently the thing keeping a deal alive across a nine-month evaluation with five stakeholders and a procurement department standing between the pitch and the signature. Content there functions as a demand-generation engine, not a support channel.
B2C isn't standing still on this either. About 33% of B2C marketers now allocate 50% or more of their marketing budget to content, well above the overall 25% figure across all business types. So while B2B leans on content structurally, B2C is catching up in raw allocation for its own reasons: volume, brand storytelling, social-first buying behavior.
The practical implication matters more than the trivia. A B2B mid-market firm spending 10% of revenue on marketing sits near the top of its peer range, while a B2C firm at that same 10% might sit right at the midpoint for its model, or below it. Same number, opposite read, and using the wrong B2B or B2C benchmark produces the identical error as using the wrong size tier: a confident decision anchored to the wrong reference point entirely.
Where content budgets are heading in 2026 and what the growth trend implies about competitive pressure
Budget sentiment shifted hard and fast. Budget sentiment shifted markedly, with the majority of businesses expecting budgets to grow or stay flat in 2025, reflecting a broader pivot from defensive cost-cutting to active investment in a short span of time.
Among B2B marketers specifically, 46% expected content budget increases in 2025, 41% expected flat spending, and only 8% anticipated cuts, per CMI's B2B research. The CMO Survey projects average marketing budget growth of 8.9% overall in 2026, with digital channels expected to capture a disproportionate share of that expansion. Content's 26% cut of that expanding base means absolute content spend is growing faster than revenue at the top line: budgets aren't just keeping pace with the company, they're outrunning it.
Here's the competitive wrinkle worth sitting with. When most of the market is adding content investment, standing still isn't neutral, it's a relative reduction, since flat is the new cut if the rest of the field is accelerating and a given team is idling. The high-spend tier shows the acceleration in concrete terms: about 31% of teams budgeted tens of thousands of dollars a month in 2026, a marked increase from prior years, according to marketful.com's data. The center of gravity for serious content programs moved upward, and it moved in one year, not five.
For leaders at any size tier, the relevant benchmark isn't today's average; it's the trajectory underneath it. Calibrating a 2026 budget to 2024 norms means planning, quite literally, to fall behind competitors who already adjusted.
Turning these benchmarks into an actual budget allocation decision
All of this data is useless without a way to apply it, so here's the two-step version. Step one: find the actual peer group by identifying revenue tier (under $10 million, $10 million to $100 million, or $100 million-plus) and business model (B2B or B2C), then pulling the corresponding range from the sections above instead of reaching for whatever industry-wide figure showed up first in a search result.
Step two: figure out where current spend sits relative to that peer group's midpoint. Above it, the question is efficiency: is that spend converting into proportionate output, or is it funding the six-week approval chains described in the enterprise section? Below it, the question is underinvestment, and the fix is rarely complexity. It's volume and consistency, the same fix that matters most at the small-business tier.
What the percentages don't reveal is whether content production is consistent enough to compound over time, a gap that shows up constantly at the small-business tier. Averages also can't show whether spend flows toward strategy-first workflows built around a conversion framework or just toward generating more content faster with no clear destination, and they say nothing about whether the team can execute at the cadence the budget implies. Roughly 63% of B2B marketers report they even know their own content marketing budget; fewer than that can confidently say their team is structured to spend it well.
That's the real bottleneck at mid-market and enterprise scale: paying for agency or production overhead that slows the operation down without measurably improving what comes out the other end. Speed and quality often get treated as a tradeoff; better content operations treat them as complements, building tools and workflows around strategy first rather than volume for its own sake.
Here's the practical takeaway, then. The benchmark is the floor of the conversation, tells you roughly where peers land, and says nothing about whether the content earns its keep. The real test is whether the current allocation produces work that converts, measured against work that simply fills a publishing calendar on schedule, and no amount of averaging will make a small B2B startup's right number match a $500 million enterprise's. The allocation decision starts with knowing, specifically and honestly, which peer group is actually the one being compared against.