Content Marketing Metrics for B2B Lead Generation
Track content's actual revenue impact, not just vanity metrics like pageviews.

Content marketing works, or at least it's supposed to. Fewer than a third of marketers with a documented content strategy call it extremely or very effective, according to industry research on B2B content marketing for 2026. That gap isn't a spend problem. It's a measurement problem, and this piece walks through exactly where the measurement breaks and what replacing it looks like in practice.
Why content deserves to be judged as a lead generation engine, not just a brand play
I've sat in enough budget meetings to know the pattern by heart. Someone from content pulls up a slide full of pageviews and social shares. Someone from sales asks how many of those became paying customers. The room goes quiet, someone checks their phone, and the meeting moves on to the next agenda item without anyone actually answering the question. That silence is the whole problem, condensed into about four seconds.
That ROI case is hard to argue against. Content marketing, per the widely cited Demand Metric benchmark, generates roughly three times as many leads as outbound at 62% less cost. Industry data puts average content cost-per-lead at $47, against $121 for paid advertising. A CFO looking at those two numbers side by side should be asking why content gets less budget than paid search, not more.
Raw cost efficiency actually undersells it, though. The real edge is time. A blog post keeps pulling in organic traffic and leads for an average of 3.5 years after it publishes, and three-year content ROI can reach 844%, but only for teams patient enough, and rigorous enough, to measure across that window. Most dashboards default to a 30-day lookback. That's like judging a tree by how it looks the week after you plant it, then deciding it's a bad tree.
So any metric worth keeping has to survive contact with time. Forget the numbers that update fastest on a Monday dashboard. What matters is whatever still means something a year out, after the campaign's forgotten and the budget's been spent twice over.
The vanity metric trap: what most teams measure and why it misleads
Vanity metrics move on their own, independent of whether anyone downstream actually buys anything. Pageviews with no session-to-lead tracking attached. Social shares and reach with no conversion path behind them. Email open rates treated as a stand-in for content quality. Total MQL count, reported with no mention of what share of those MQLs were any good.
These numbers survive because they're easy. They sit in every dashboard, refresh in real time, climb during a campaign, and that upward line feels like proof of work even when it isn't. Nobody gets in trouble for a pageview chart that's up and to the right. Somebody does eventually get in trouble for the pipeline that isn't.
MQL-to-SQL conversion across B2B SaaS sits well below where many teams expect it, a real drop that isn't noise. That's a real drop, not noise. Pushing harder on top-of-funnel volume has stopped paying off, and it may be actively hurting quality, since more unqualified traffic just means more noise for sales to sort through by hand. A team that keeps reporting MQL totals without pairing them to that conversion rate is, whether it means to or not, papering over the erosion underneath.
The cost shows up twice, and neither time is subtle. Content investment gets steered in the wrong direction, and then the case for more budget becomes almost impossible to defend the next time finance asks a direct question about what any of it actually returned.
The funnel conversion benchmarks that reveal where content is actually working
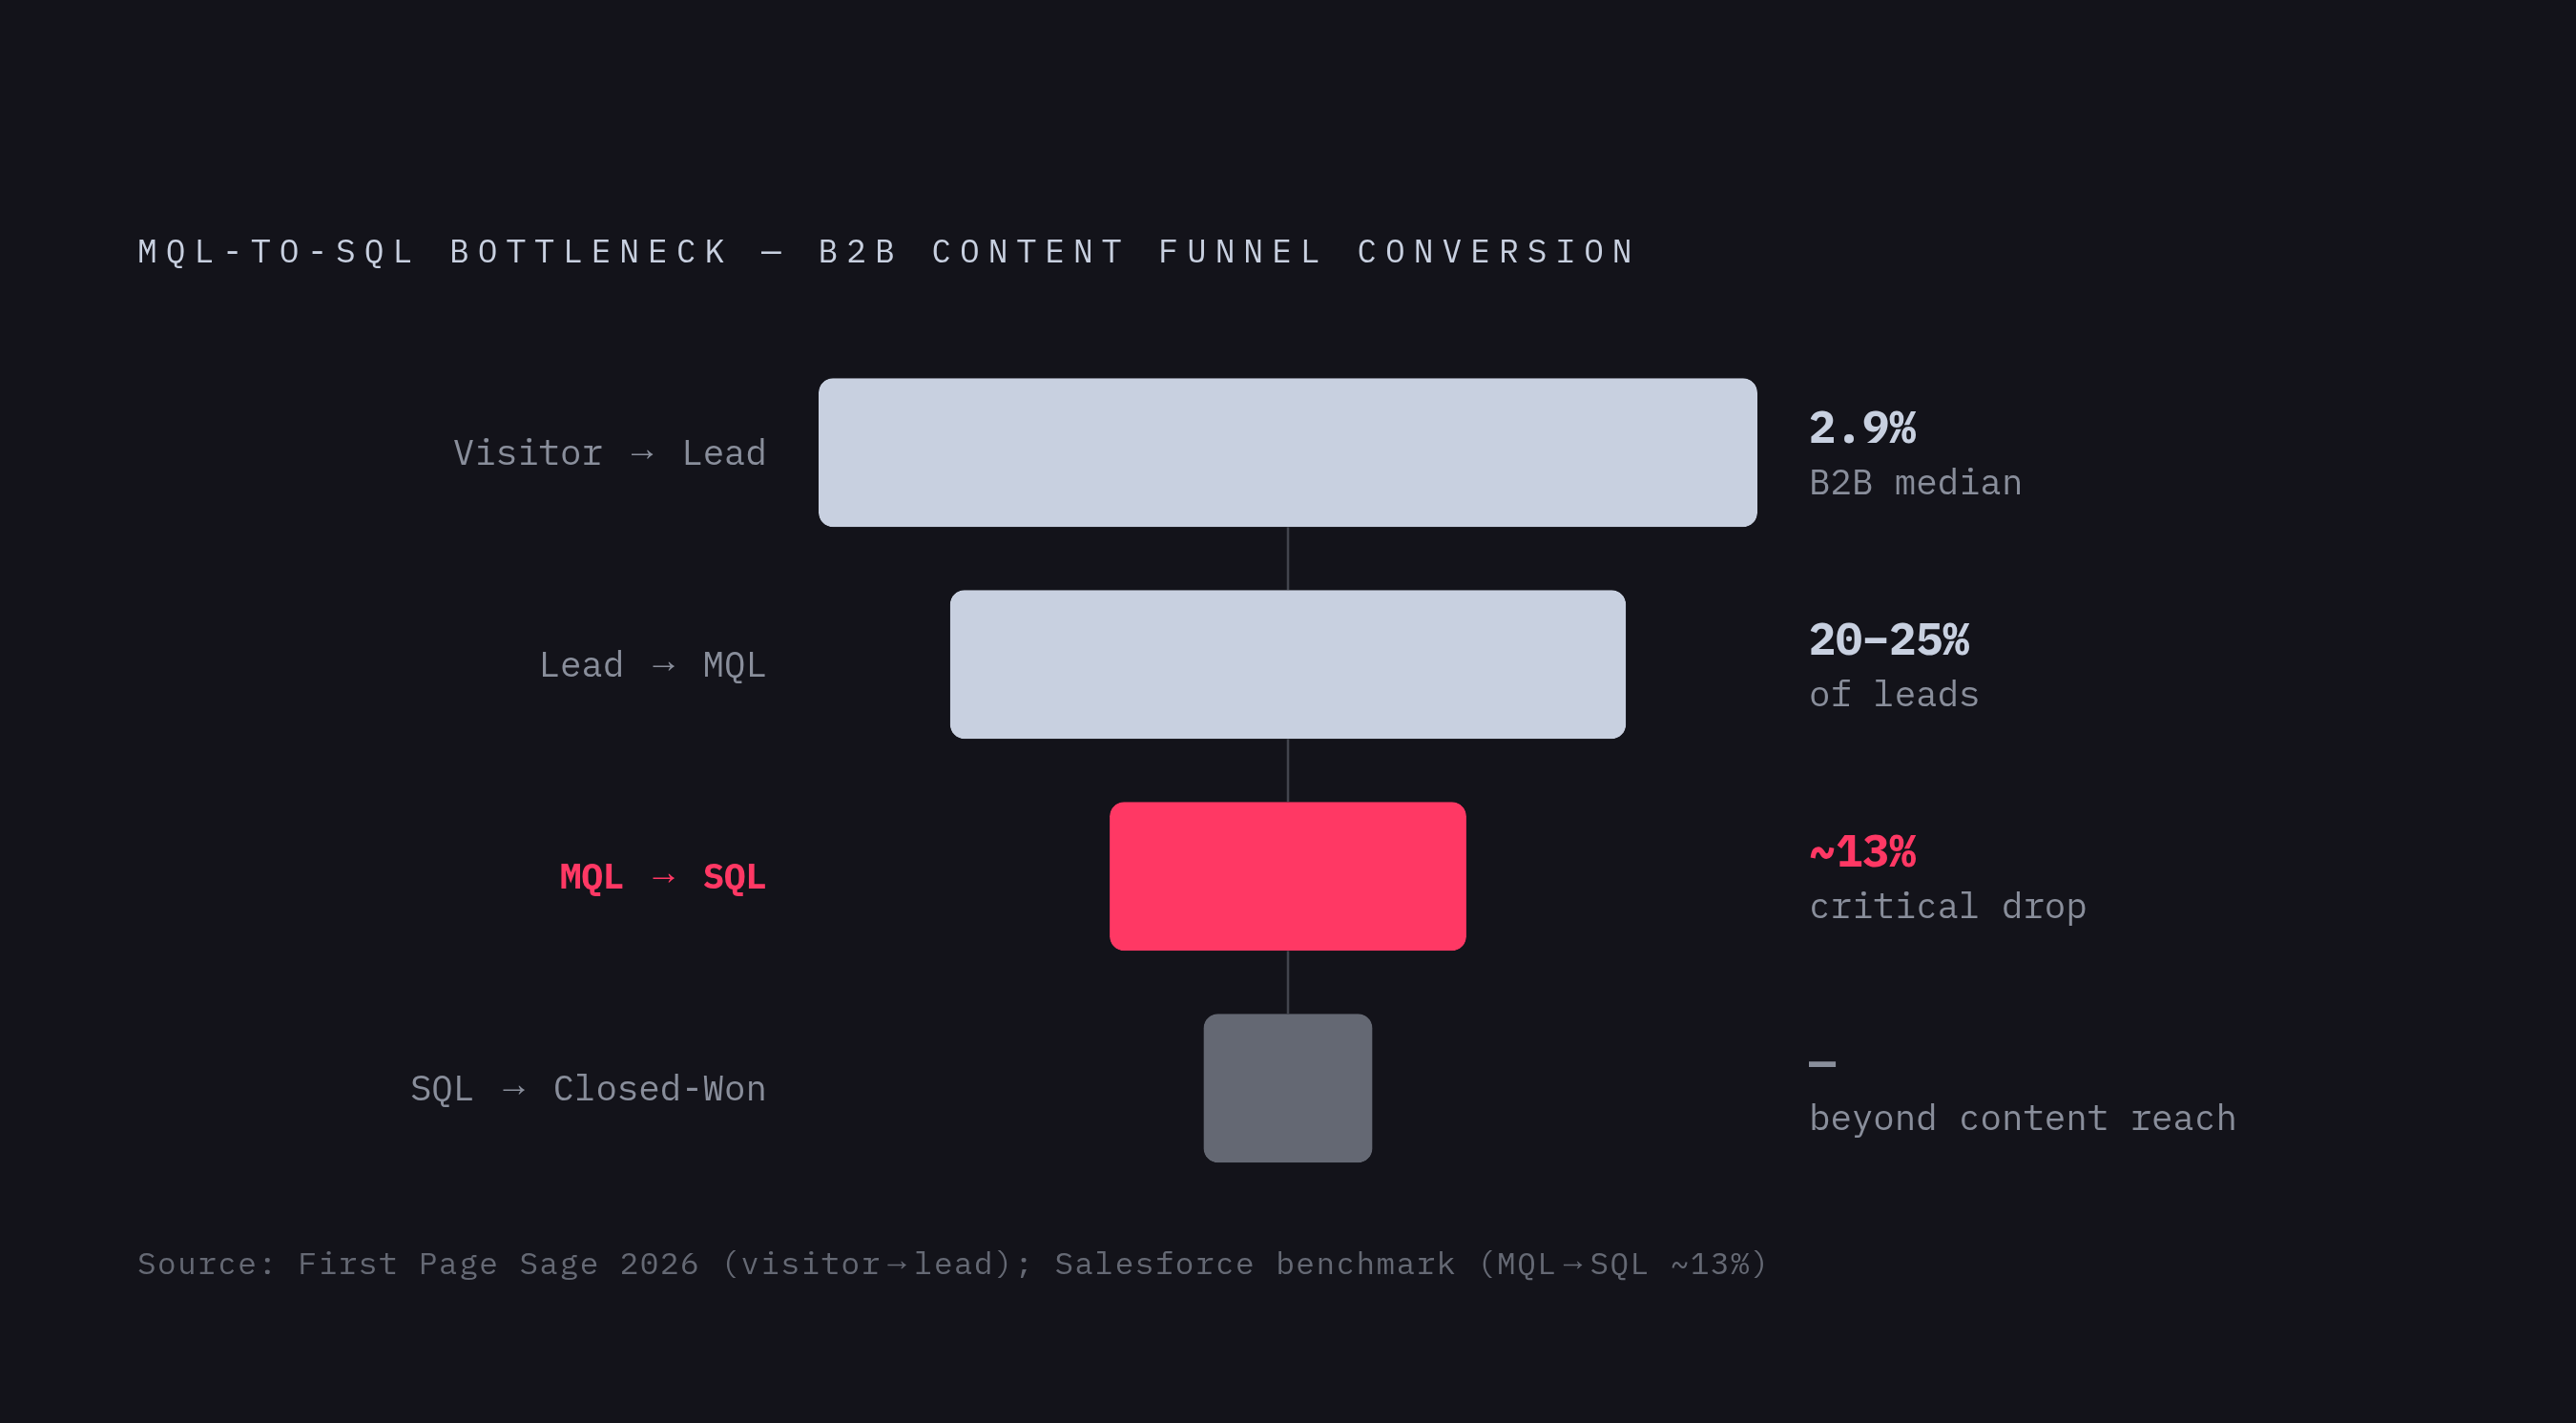
Start with the shape of the whole funnel. That's where the actual bottleneck lives, instead of wherever you happen to be guessing this week.
Visitor-to-lead conversion sits at a median of 2.9% in B2B, per First Page Sage's 2026 analysis. Lead-to-MQL runs roughly 20 to 25% in a healthy pipeline. MQL-to-SQL benchmarks at 12 to 18%, which puts that Salesforce figure of 13% right near the floor, not comfortably in the middle. SQL-to-opportunity and closed-won rates matter too, but they mostly sit outside content's reach; content's job, fairly measured, ends around SQL quality.
Conversion swings hard by offer type. Gated content downloads, the classic name-and-email trade, tend to pull high volume but lower intent compared to more active conversion actions. Demo request pages tend to attract higher-intent visitors, though conversion rates vary considerably across organizations. Free trial signups carry a strong intent signal for SaaS specifically. High-friction forms convert poorly unless the offer is compelling enough to justify the effort, because friction has to be earned with something the visitor wants badly enough to complete the form for.
Industry spread widens the picture further. Legal services hits 7.4% visitor-to-lead by First Page Sage's numbers, more than double the general median. So benchmarking against an industry-wide average is close to useless if your sector runs differently, and most sectors do run differently. If your visitor-to-lead number sits under the median for your industry, the likely culprit is offer relevance or landing page friction, not traffic volume. Funnel more visitors into a bad offer and all you get is more people who bounce and forget you exist by lunchtime.
Content-attributed pipeline: the metric that actually connects to revenue
Content-attributed pipeline is the dollar value of opportunities where content played a traceable role in starting the deal or moving it forward. Not "content-influenced," which usually just means the lead touched a blog post at some point in the CRM history and someone decided that counted. Attributed means you can point to the specific touch and defend it out loud, in a meeting, to someone who's actively skeptical.
Building it takes three things working together: UTM tagging that's actually consistent, a CRM that carries those tags through the full lifecycle, and an agreement with sales on what counts as a "content touch" in the first place. Skip that last part and the whole exercise turns into a quarterly argument nobody wins, least of all you.
This is the number that survives contact with a CFO. Pageviews can't answer what content spend actually returns. Content-attributed pipeline can, because it's denominated in the same currency as the rest of the revenue conversation.
In practice, that means tagging every content-sourced lead at entry, tracking it through CRM stages rather than just capturing first touch, and assigning pipeline value at the SQL stage rather than MQL. That last part matters more than it sounds, because valuing at MQL lets the erosion problem from the last section creep quietly back into your reporting. Report the number monthly, next to CPL for whatever content produced it, so cost and value sit in the same conversation instead of two different slide decks nobody cross-references.
Landbase's 2026 data shows properly scored and qualified leads converting far above unqualified prospects, a gap wide enough that lead quality tracking and pipeline attribution can't really be separated anymore. They're the same exercise, just viewed from two different angles.
One more wrinkle: the attribution model you pick changes the story you tell yourself. First-touch inflates the assets at the top of the funnel. Last-touch inflates whatever closed the deal, usually something bottom-funnel like a demo page. Linear or time-decay models spread credit across the whole buyer journey, which is messier to explain on a slide but closer to how buyers actually behave.
Cost per lead by channel: how content benchmarks stack up and what they signal
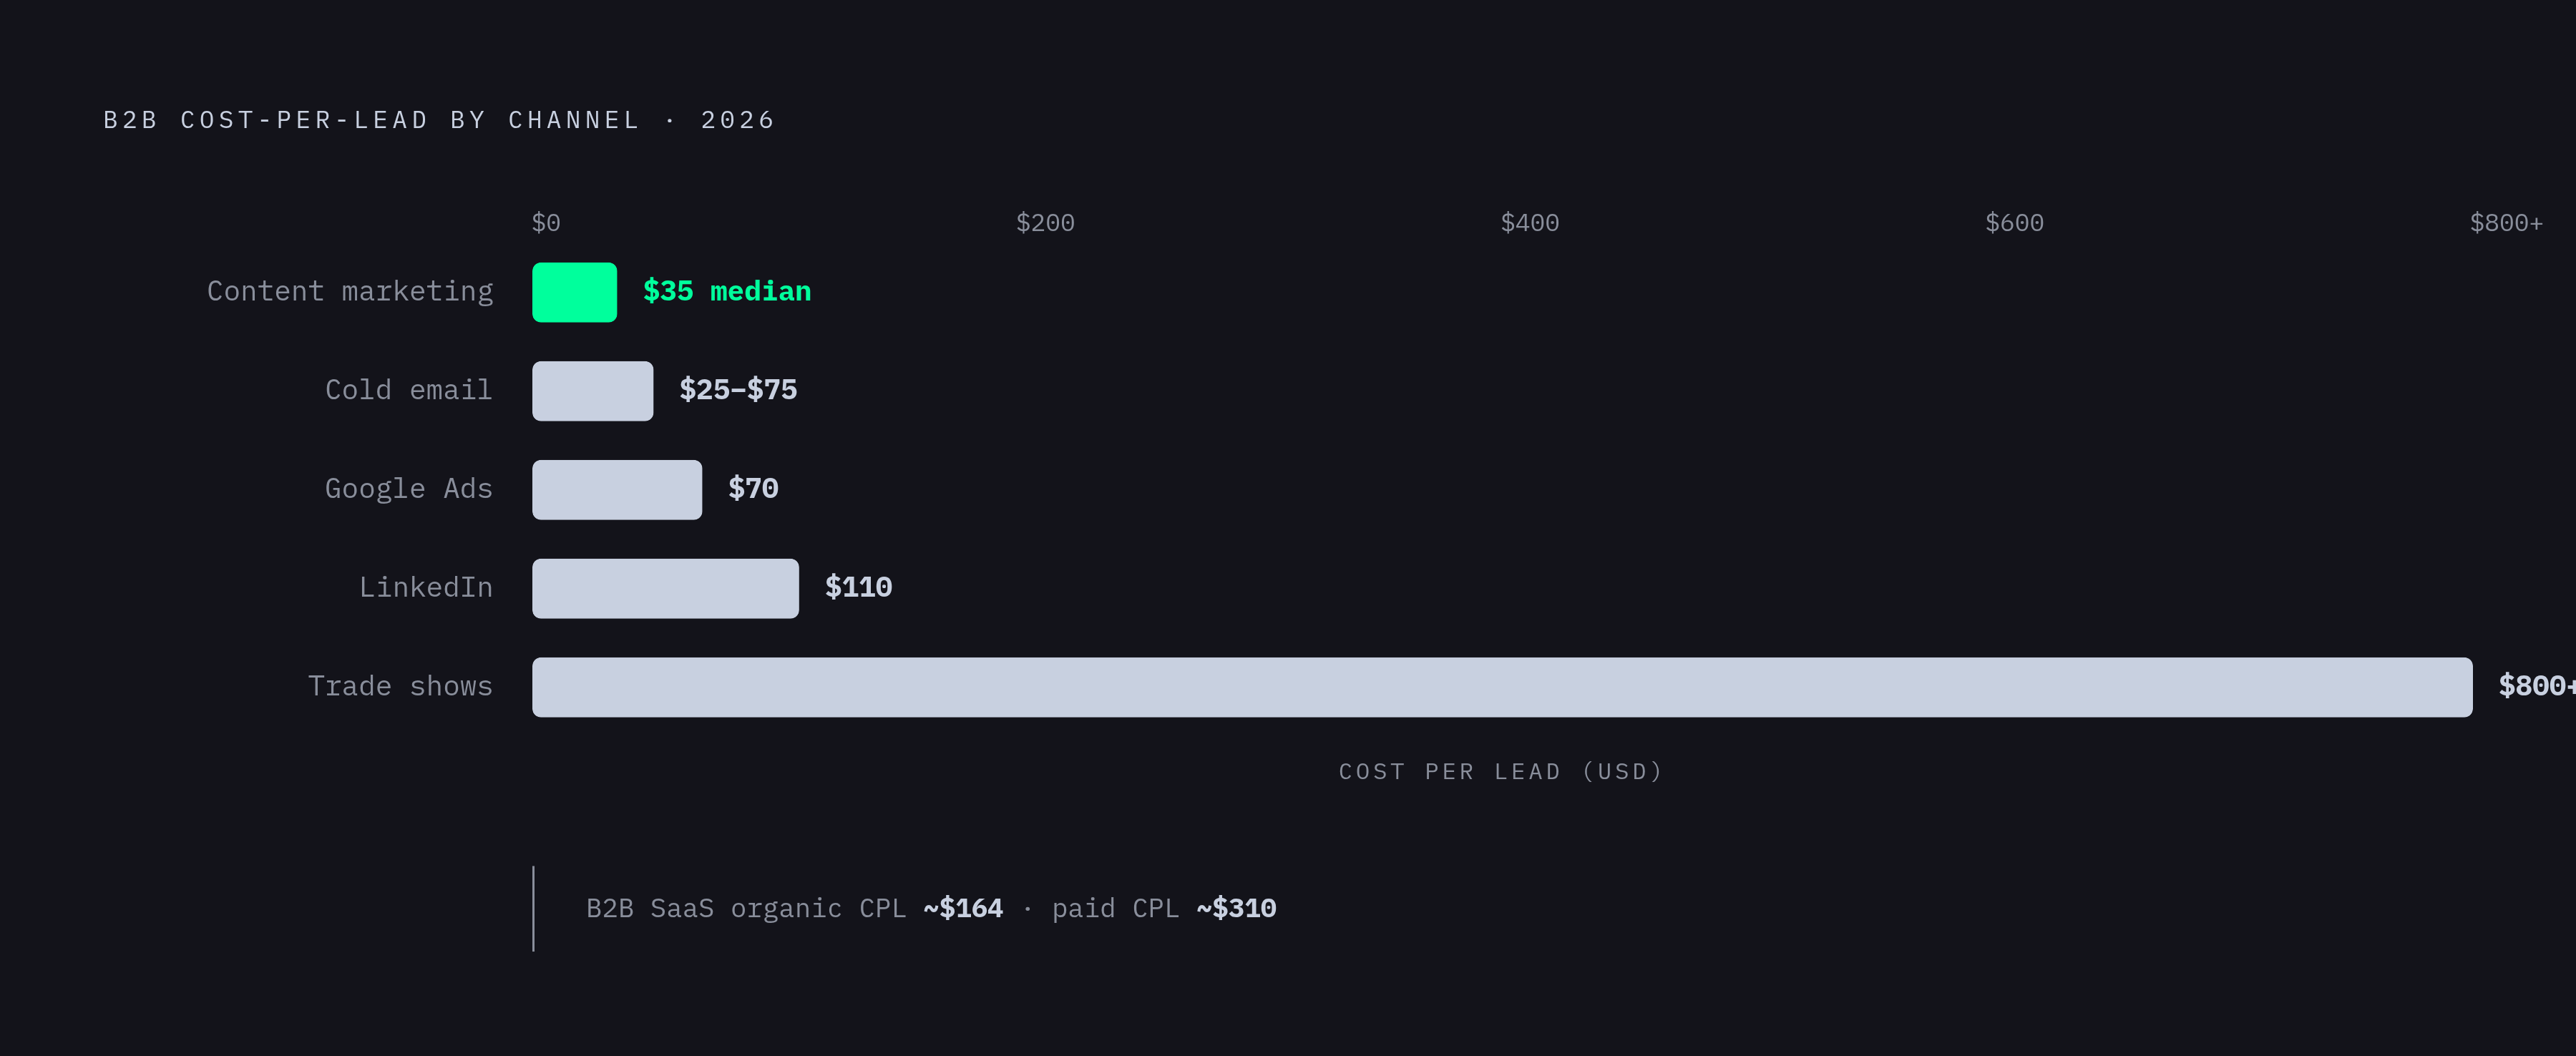
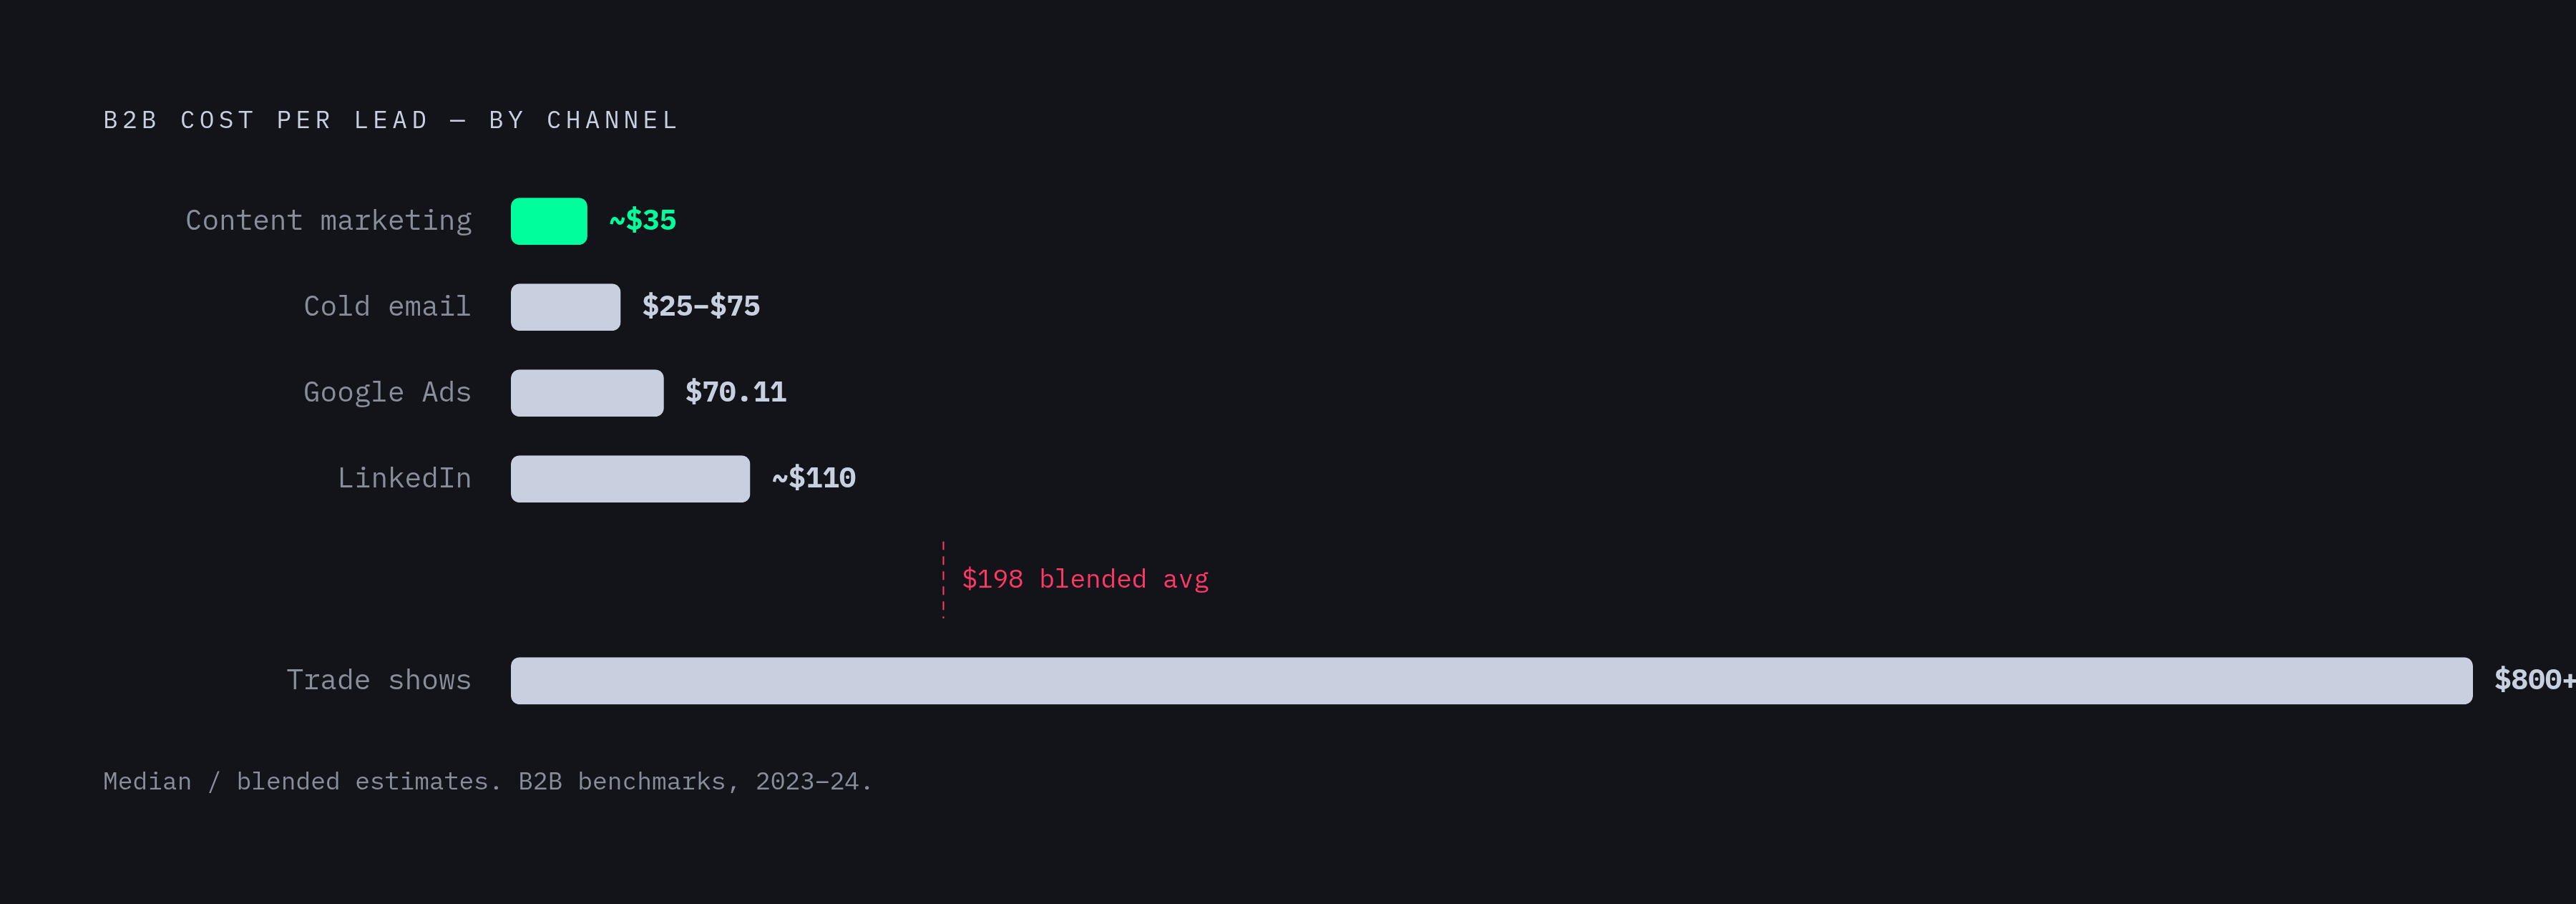
Blended average B2B cost-per-lead sits around $198 in 2026, but that average hides a spread wide enough to drive a truck through. Cold email runs $25 to $75. Content marketing sits at a median around $35, per The Starr Conspiracy's 2025 numbers. Google Ads costs $70.11, up from $66.69 the year before, about 5% inflation in twelve months. LinkedIn runs around $110. Trade shows clear $800 and up, and that's before the branded tote bags.
The organic-versus-paid gap is widest in B2B SaaS specifically: roughly $164 for organic against $310 for paid, nearly double. That's a real argument for organic content investment even on channels where leads take longer to mature into anything resembling revenue.
Some industries make the case even harder to ignore. Financial services runs a blended CPL of $653. Software development sits at $591. Transportation and logistics comes in at $588, manufacturing at $553. Shave even a modest amount off content CPL in those verticals and it saves serious money once it scales across a full pipeline.
CPL alone, though, can be just as misleading as pageviews. A $35 content lead that never converts costs more, in every way that actually matters, than a $110 LinkedIn lead that turns into a high-value deal. Read CPL alongside MQL-to-SQL rate and average deal size for that channel; on its own it's an incomplete thought, not a decision you can act on.
Quick housekeeping, since this trips people up more than it should: plenty of CPL tables floating around in 2026 content trace back to 2017 data nobody bothered to update. Check the vintage on any benchmark before it goes into a board deck.
Which content formats generate leads worth tracking and which inflate the top of the funnel
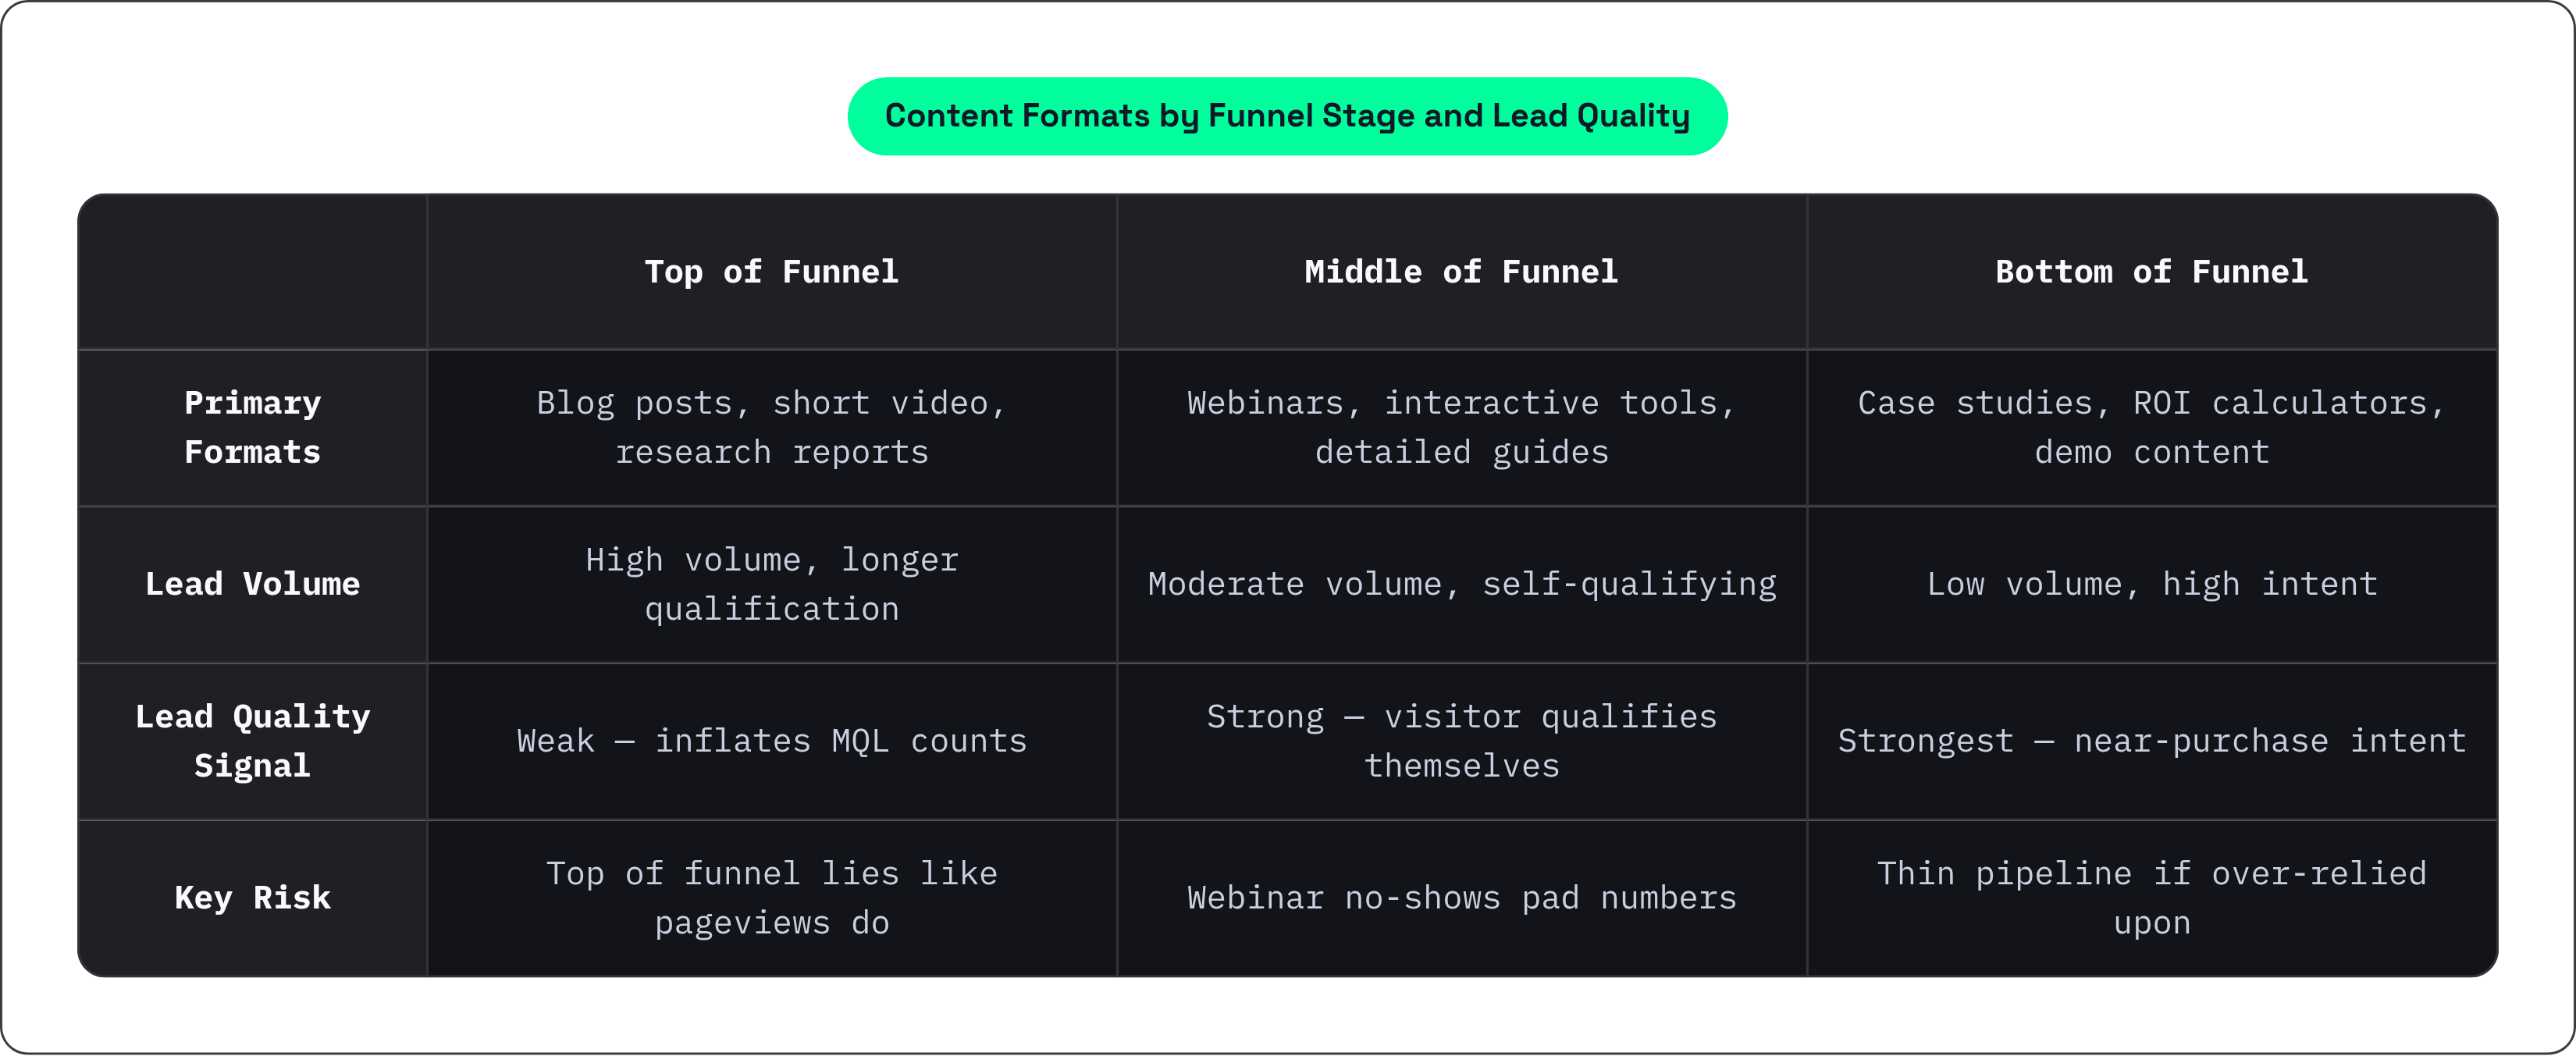
Not all content pulls its weight the same way. Research on content format performance draws a fairly clear line between formats that generate real leads and formats that just generate numbers that look nice in a recap email.
Original research reports, the kind built on benchmark data nobody else has, produce the highest-quality leads of any format tracked. Interactive assessments, things like maturity models or readiness scoring tools, do something even more useful: they let the visitor qualify themselves before a salesperson ever picks up the phone. Webinars with live Q&A pull leads in at multiple funnel stages, and the on-demand replay keeps generating leads for months after the live session wraps. Case studies and customer stories consistently rank among top-performing formats in B2B content research, which tracks with the plain fact that buyers trust other buyers more than they trust anyone trying to sell them something.
Blog posts and SEO content play a longer game. Volume is high, the qualification timeline stretches out, but the cost efficiency holds up over time in a way paid channels never quite manage. The compounding effect of SEO makes the wait worthwhile over a multi-year horizon. First Page Sage's 2026 numbers put median SEO ROI at 748%, with B2B SaaS specifically at 702% and a typical break-even around 7 months.
Video earns its keep differently. It delivers ROI 49% faster than text content, useful for shortening the gap between top-of-funnel awareness and SQL, provided there's an actual conversion path attached and not just a nice thumbnail sitting there doing nothing.
Matching format to funnel stage matters more than chasing whatever format is trending on LinkedIn this month. Blog posts, short video, and research reports do the heavy lifting at the top. Webinars, interactive tools, and detailed guides carry the middle. Case studies, demo-adjacent content, and ROI calculators close things out at the bottom.
One flag worth raising: low-friction downloads, the eBooks and whitepapers asking for nothing but an email address, inflate MQL counts without doing much for pipeline. Track form completions for these against downstream SQL conversion by asset, or the top of the funnel starts lying to you the same way pageviews always have.
Speed-to-lead and follow-up discipline as the metric most content teams ignore
Here's a metric almost nobody on the content side tracks, and it might matter more than half the ones they do. The gap between a lead coming in and that lead turning into an opportunity is, in large part, a speed problem, not a content problem, though content teams rarely take the blame since it happens downstream of them, out of sight.
Responding within 60 seconds produces a dramatic jump in conversion, according to Kixie's 2025 research, and Harvard Business Review's work on lead response found the odds of qualifying a lead drop sharply once you're past the first five minutes. Five minutes. Not five hours.
Yet the average B2B response time runs 42 to 47 hours. A meaningful share of companies take five days or longer, or never respond at all, which is its own kind of answer. Content does its job, generates a genuinely qualified lead, and then that lead sits in an inbox until the intent that brought them there has evaporated. That's not purely a sales failure. It's a measurement failure too, because nobody flagged it as a problem worth watching in the first place.
What to track: average response time by content source, broken out by channel and by asset. A content team that can show which of its assets generate leads sales responds to fastest has a genuinely strong argument in any internal prioritization fight, because it's proof the asset isn't just generating volume. It's generating leads sales actually wants to work.
This metric functions as shared accountability in a way most content metrics don't. It exposes whether the handoff between marketing and sales actually works, and it's one lever content teams can pull directly, by flagging high-intent signals (demo requests, ROI calculator completions) for immediate routing instead of letting them sit in a queue.
Building a measurement framework that ties content to pipeline in practice
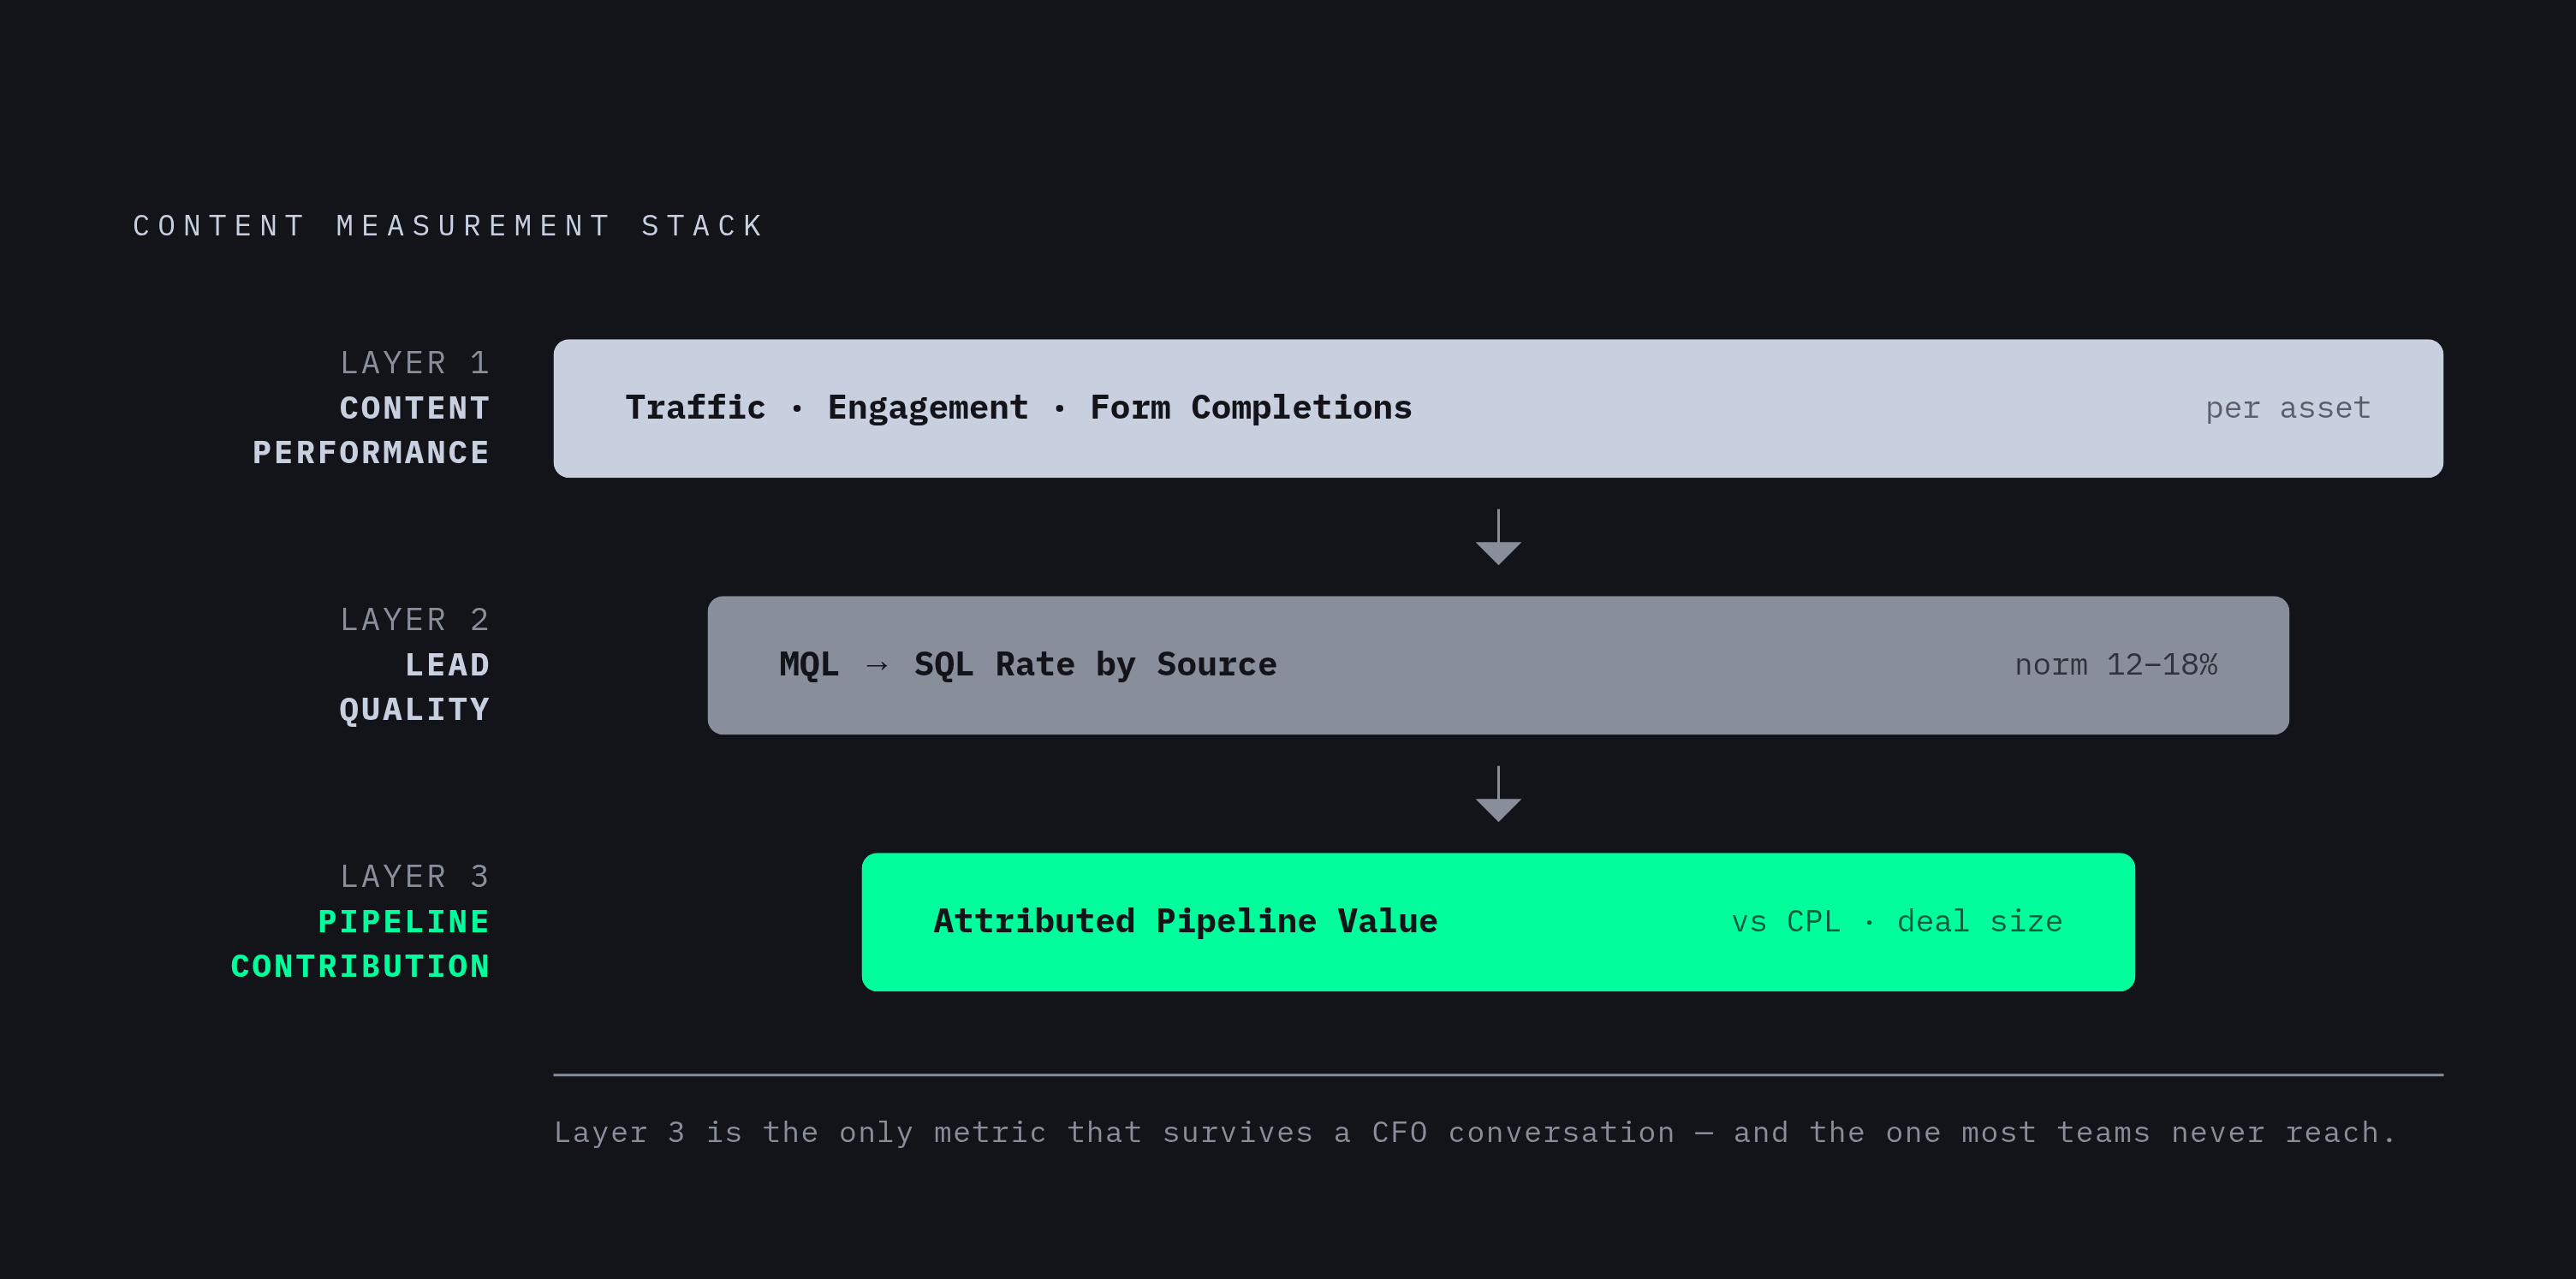
Put this together and you get three layers, stacked by how far each sits from revenue. Not because three is a magic number, but because that's genuinely how the data flows: from asset, to lead, to dollars.
Layer one is content performance: which assets drive traffic, engagement, and form completions. Track this by individual asset, not channel average, or you'll never spot the one blog post quietly carrying the rest of the team's numbers. Flag anything with high traffic and low conversion for a hard look at the offer or landing page attached to it.
Layer two is lead quality: what share of content-sourced leads actually make it to SQL. MQL-to-SQL rate by source is probably the single most diagnostic number in this whole framework. Measure it against that low-end Salesforce benchmark. Anything well below it suggests the content is pulling in the wrong audience, not just an unqualified one, which is a targeting problem, not a volume problem, and the fix is different depending on which one you've actually got.
Layer three is pipeline contribution: content-attributed pipeline value set against CPL and average deal size. This is the number for the board deck. It needs clean CRM data and consistent UTM tagging behind it, so get those habits right first, before optimizing anything downstream of them.
Documentation isn't a side note here. CMI's 2026 research found companies with a documented content strategy are 3.5 times more successful than those without one, and that same discipline, applied to how you measure rather than just how you plan, compounds in roughly the same way over time.
Cadence matters too, and it doesn't need to be complicated. Weekly: CPL, lead volume by asset, response time. Monthly: MQL-to-SQL by channel, pipeline added by content source. Quarterly: a full attribution review, ROI by content type, and whatever budget reallocation decisions actually come out of that review.
None of this needs enterprise software or a six-figure martech stack sitting behind it. It needs marketing and sales to agree on what a qualified lead means, tags applied the same way every single time without exception, and one dashboard both teams actually open. Fewer numbers, better ones, read by people who agree on what they mean before the meeting starts.
Sources
- https://contentmarketinginstitute.com/b2b-research/b2b-content-marketing-trends-research-2025
Provided the finding that fewer than a third of marketers with a documented content strategy call it extremely or very effective, and the statistic that companies with a documented strategy are 3.5 times more successful.
- https://theleadcrafters.com/lead-generation/lead-generation-benchmarks-and-conversion-rates-in-2025/
Provided the MQL-to-SQL conversion benchmark context used to illustrate the erosion problem in B2B SaaS pipelines.
- https://martal.ca/cost-per-lead-by-industry-lb/
Provided Google Ads CPL figures ($70.11 and $66.69), the year-over-year inflation rate, and the organic versus paid CPL comparison for B2B SaaS ($164 organic vs. $310 paid).
- https://www.thestarrconspiracy.com/insights/guides/lead-generation-cost-per-lead-benchmarks-2025
Provided the content marketing median cost-per-lead figure of $35 cited in the channel cost comparison section.