SEO Content ROI Calculation for New Blogs
A formula that works before your blog has traffic or revenue.

SEO ROI math breaks for a new blog because the standard formula wants revenue you don't have yet. So this piece builds a different model, one that runs on keyword data and click-through assumptions instead of results that don't exist. By the end you'll have a two-scenario forecast and a short list of things to check every month to see if reality is behaving.
Everyone learns the same formula first: ((Revenue − Investment) / Investment) × 100. It's clean and intuitive, but completely useless on day one of a new blog, since there's no revenue, no traffic history, and no baseline conversion rate to measure against. Plug zero into that equation and you don't get a percentage, you get a shrug. The formula that actually works before you've published a single post looks like this instead: Total Monthly Searches × CTR × Conversion Rate × Lead Value = projected monthly return. Four inputs, four estimates, and each one carries its own margin of error that compounds as it moves down the chain. Get the keyword volume slightly wrong and the conversion rate slightly optimistic, and your projected return can be off by three or four times before you've spent a dollar on anything.
What a new blog actually costs to run, and how to define the investment side
Most people lowball the investment side because they only count what shows up on an invoice. A real accounting includes people (writers, editors, strategists, a developer if there's technical work), tools, content production, distribution spend where it applies, and maintenance, which is the line item everyone forgets exists. Old posts need refreshing, links break, and page experience needs babysitting; none of that stops the day you hit publish.
For calibration: monthly SEO retainers typically run $1,000 to $2,500, according to a Backlinko survey of over 300 SEO professionals from 2025. Shopify's research found 63% of businesses spend between $500 and $5,000 a month on SEO services, which is such a wide band it's really only good as a sanity check, not a target. Freelance agency rates average around $115.61 an hour, per a 2025 analysis of 350 agencies by Loopex Digital. Content writing runs roughly $0.25 to $1.00 per word depending on technical complexity, with SEO-optimized pages often starting around $150 apiece. Add it up and a growth-stage blog running regular content, some technical fixes, and link building usually lands in the $2,000 to $5,000-a-month range.
Composition matters as much as the total. Most SEO budgets put the largest share into content creation, with the rest split across link building, technical work, tools, and reporting. If your budget looks nothing like that general shape, that's not automatically wrong, but it's a question to sit with.
Here's the part that quietly flatters every ROI calculation done in-house: staff time isn't free just because nobody invoices for it. If your marketing coordinator spends six hours a week on keyword research and content briefs, that's a real cost, and leaving it out makes the ROI look better than it actually is. AI-assisted content workflows, the kind that pair AI drafting with real editorial review rather than skipping it, can compress per-piece costs meaningfully. That matters later, when you're modeling output per dollar, because the cost side shifts with whatever tools and workflow sit behind it.
How to pick realistic keyword targets and pull a monthly search volume number
Total Monthly Searches is the first term in the formula, so keyword selection is where the whole model either finds solid ground or floats off into fiction. A new blog cannot compete for high-volume head terms in year one. The domain authority needed to rank page one for something like "project management software" takes years, not months, and modeling as though you'll grab a slice of that traffic by month six sets an expectation nothing in the data supports.
Long-tail keywords are the practical starting point, and not just because they're less crowded. Individually they carry lower volume, sure, but they deliver three to five times higher click-through rates and two to three times better conversion rates than short-tail queries, according to research from The Stacc. Stack enough long-tail posts into a cluster and the combined volume adds up to something real, even when no single post is pulling much weight on its own.
How do you actually find these? Look for low difficulty scores in whatever research tool you use, favoring question formats, comparisons, and "how to" queries, since informational intent lines up naturally with what a blog post is built to do. Then check who's sitting in those results already. If it's wall-to-wall high-authority domains with a decade of backlinks behind them, that keyword isn't winnable in year one no matter how good the post is.
Build the model keyword by keyword, not as one aggregated blob. Slower, yes, but it forces you to set targets you can actually defend, and it makes the whole thing easier to sanity-check six months from now. When you plug in a volume figure, use the number for the exact keyword you're targeting, since category-level estimates feel generous and mean almost nothing.
Applying click-through rate assumptions that reflect what search results actually look like in 2025 to 2026
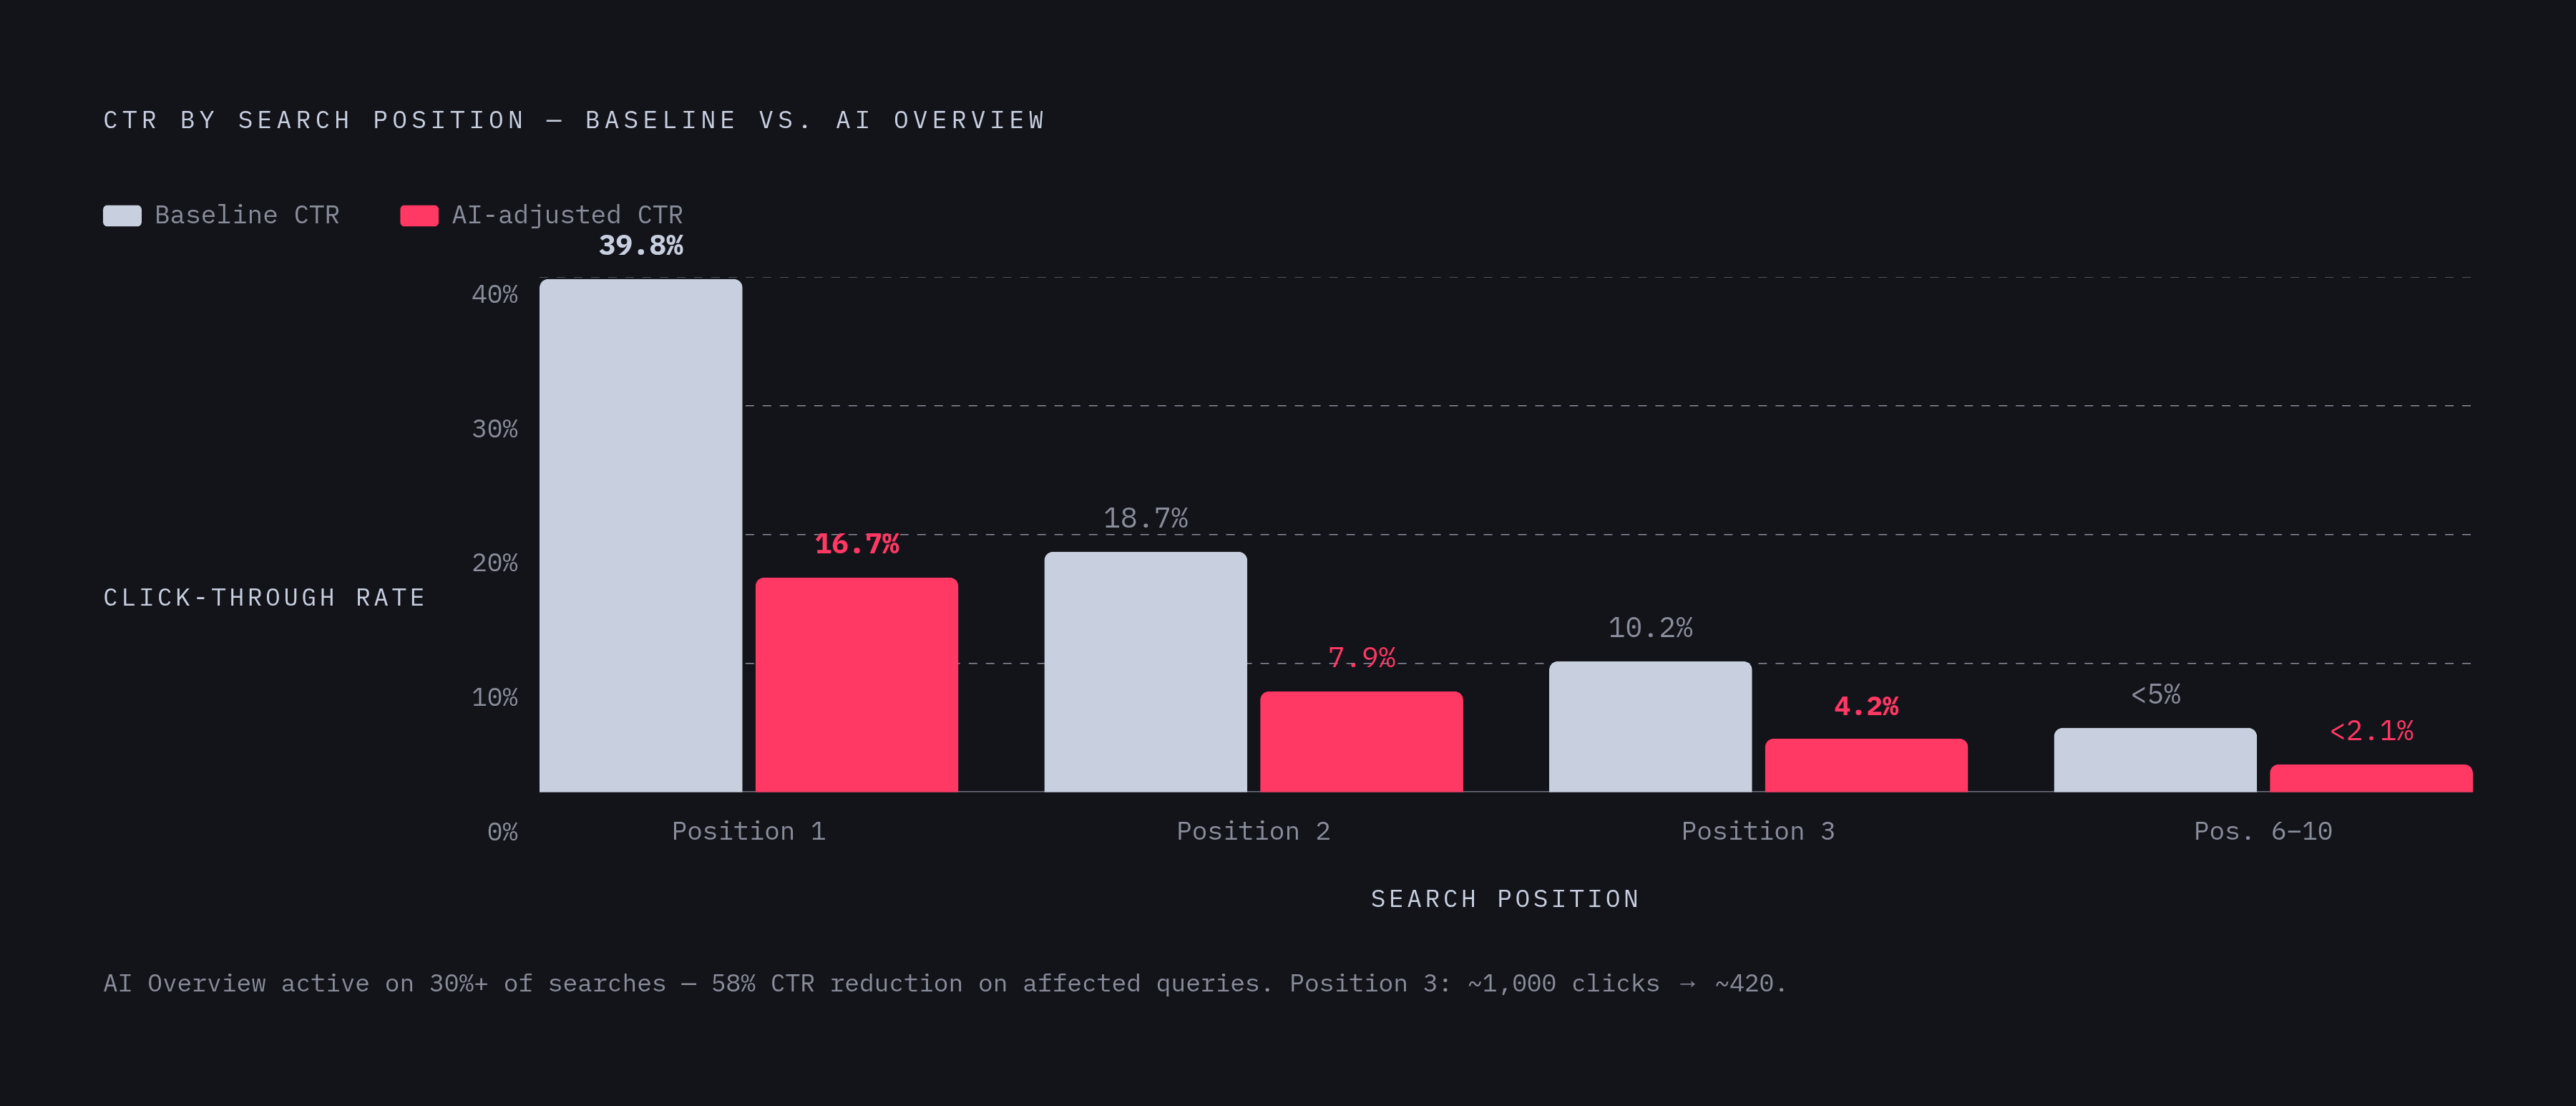
CTR is where new-blog forecasts drift from optimistic into fantasy, and the results page has changed enough recently that old benchmarks won't save you. Start with the baseline, the version without AI Overviews cluttering the page. Position 1 captures roughly 39.8% of clicks, position 2 about 18.7%, position 3 around 10.2%, and positions 6 through 10 combined pull in less than 5%, per Rank.ai's 2025 data. First Page Sage's 2026 figures back this up: the top three positions alone capture 68.7% of all clicks on a page. The drop after position 3 isn't gradual; it's a cliff.
Now the correction that no 2025-2026 model can skip. AI Overviews now show up on more than 30% of all queries, up sharply from early 2025. Queries that trigger an AI Overview show an 83% zero-click rate, compared to 60% on queries without one, according to The Stacc's July 2026 data. Ahrefs looked at 300,000 keywords in 2026 and found AI Overviews correlate with a 58% drop in click-through rate for pages ranking at the top. GrowthSRC's study of 200,000 keywords found average CTR for positions 1 through 5 fell roughly 17.92% in 2025 versus the year before, which is close to a fifth of your expected clicks gone before anyone clicks anything.
Is there an offset? A partial one: sites cited inside an AI Overview see about 35% more clicks than sites that aren't, so structuring content to earn that citation, clear definitions, direct answers, well-organized sections, is worth doing on its own merits regardless of what it does for the model. But the rule for the forecast itself stays conservative anyway: run two scenarios, one with AI Overviews present and one without, and plan around the lower number. Informational content, which is most of what a new blog publishes, sits right in the crosshairs of zero-click behavior. Build that in now rather than discovering it three months into the campaign.
Worked example: 10,000 monthly searches at position 3 (10.2% CTR) gives roughly 1,000 clicks. Apply the 58% AI Overview reduction and that drops to about 420. Carry the 420 forward, not the 1,000.
Choosing a conversion rate input that reflects what blog content actually does
Not all conversions are equal, and this is where a lot of models quietly cheat. A blog post converts differently than a pricing page, and a guide converts differently than a demo request form. Lump them together and you get a number that flatters the model instead of describing anything real.
Organic search tends to convert at a meaningfully higher rate than most channels, but industry averages blend every page type, product pages included, so they're the wrong anchor for a blog specifically. For B2B blogs, blog-to-lead conversion is generally understood to sit in a low single-digit range, and the low end of that range is the honest number for a new blog with no established trust and no audience yet. Educational content with tight intent alignment can perform at the higher end of that range, but those results usually assume an established audience, a sharp call to action, and a lead magnet worth trading an email address for. A brand-new blog has none of that.
Practically: use 1% as your conservative input for a new B2B blog, 2 to 3% as the optimistic case once the blog has some traction behind it. The conversion path matters too. Blog to email signup to nurture sequence to eventual sale has more steps than blog to demo request, and every step shaves off some percentage of the people who started the journey. Define what "conversion" means before you set a rate at all. A newsletter signup and a qualified sales lead are not the same event, and treating them as interchangeable is how models get inflated without anyone noticing until the quarter ends.
One thing working in organic's favor structurally: SEO's conversion rate tends to outperform paid search, mostly because organic visitors show up already looking for an answer instead of reacting to an ad they scrolled past. Worth naming that advantage when you present the model, even while the raw number for a brand-new blog starts lower than either benchmark.
Assigning a lead or customer value to complete the revenue side
The formula's output is only as trustworthy as the lead value plugged into it, and this is the input most likely to get inflated by hope. Three approaches suit different businesses. Average Order Value works cleanest for e-commerce, where you use the average transaction value per converted visitor directly. Lifetime Customer Value fits subscription businesses, discounted to present value so you're not counting money you haven't collected as though it's already sitting in the account. Cost-per-lead equivalent works for B2B blogs where the sale closes offline, somewhere the analytics can't see; here you use whatever you'd otherwise pay a paid channel to generate an equivalent lead.
Worked through: a hypothetical volume of monthly searches, a position-3 CTR, a 3% conversion rate, and an illustrative lead value, comes out to a substantial projected monthly return. Apply the AI Overview reduction and clicks drop significantly, which brings the number down considerably. That $400 is illustrative, not gospel. Your real figure comes from your own sales data or a calculated cost-per-acquisition pulled from paid channels you're already running.
The most common mistake here is using the full deal value instead of the per-lead contribution. A large contract looks great sitting in a spreadsheet, but if your close rate on leads is 5%, the actual value per lead for modeling purposes is a fraction of that figure, not the full contract value. Skip that step and your projected ROI balloons into something no salesperson on your team would recognize.
There's a second lens worth having: traffic value as a proxy. Multiply projected organic clicks by the cost-per-click you'd pay for equivalent paid traffic, and you get a rough dollar figure for what that traffic would've cost to buy instead of earn. Useful for justifying investment to anyone who thinks in ad-spend terms. Treat it as cost-avoidance visibility, not booked revenue, and keep that line clear in the room.
Mapping the timeline: when the model's projected return actually starts to show up
The formula spits out a monthly number, but it says nothing about when that number becomes real, and for a new blog that gap is the single most important thing to fill in before you show this to anyone with a budget to approve. New domains typically spend two to six months in what's commonly called a sandbox period, where organic traffic sits near zero no matter how good the content is. In competitive or trust-sensitive industries, that stretch can run nine or twelve months. Nobody enjoys hearing this, least of all whoever signed off on the budget.
What does a realistic ramp look like in practice? A three-month-old software blog with 60 well-built articles might still be pulling only 300 to 500 organic visits a month. The same blog seven months in, with completed topic clusters and a few earned backlinks, might reach 3,000 to 5,000 monthly organic visits, according to data from Hostragons. That's how long trust takes to build in a search index. It isn't a failure of the writing.
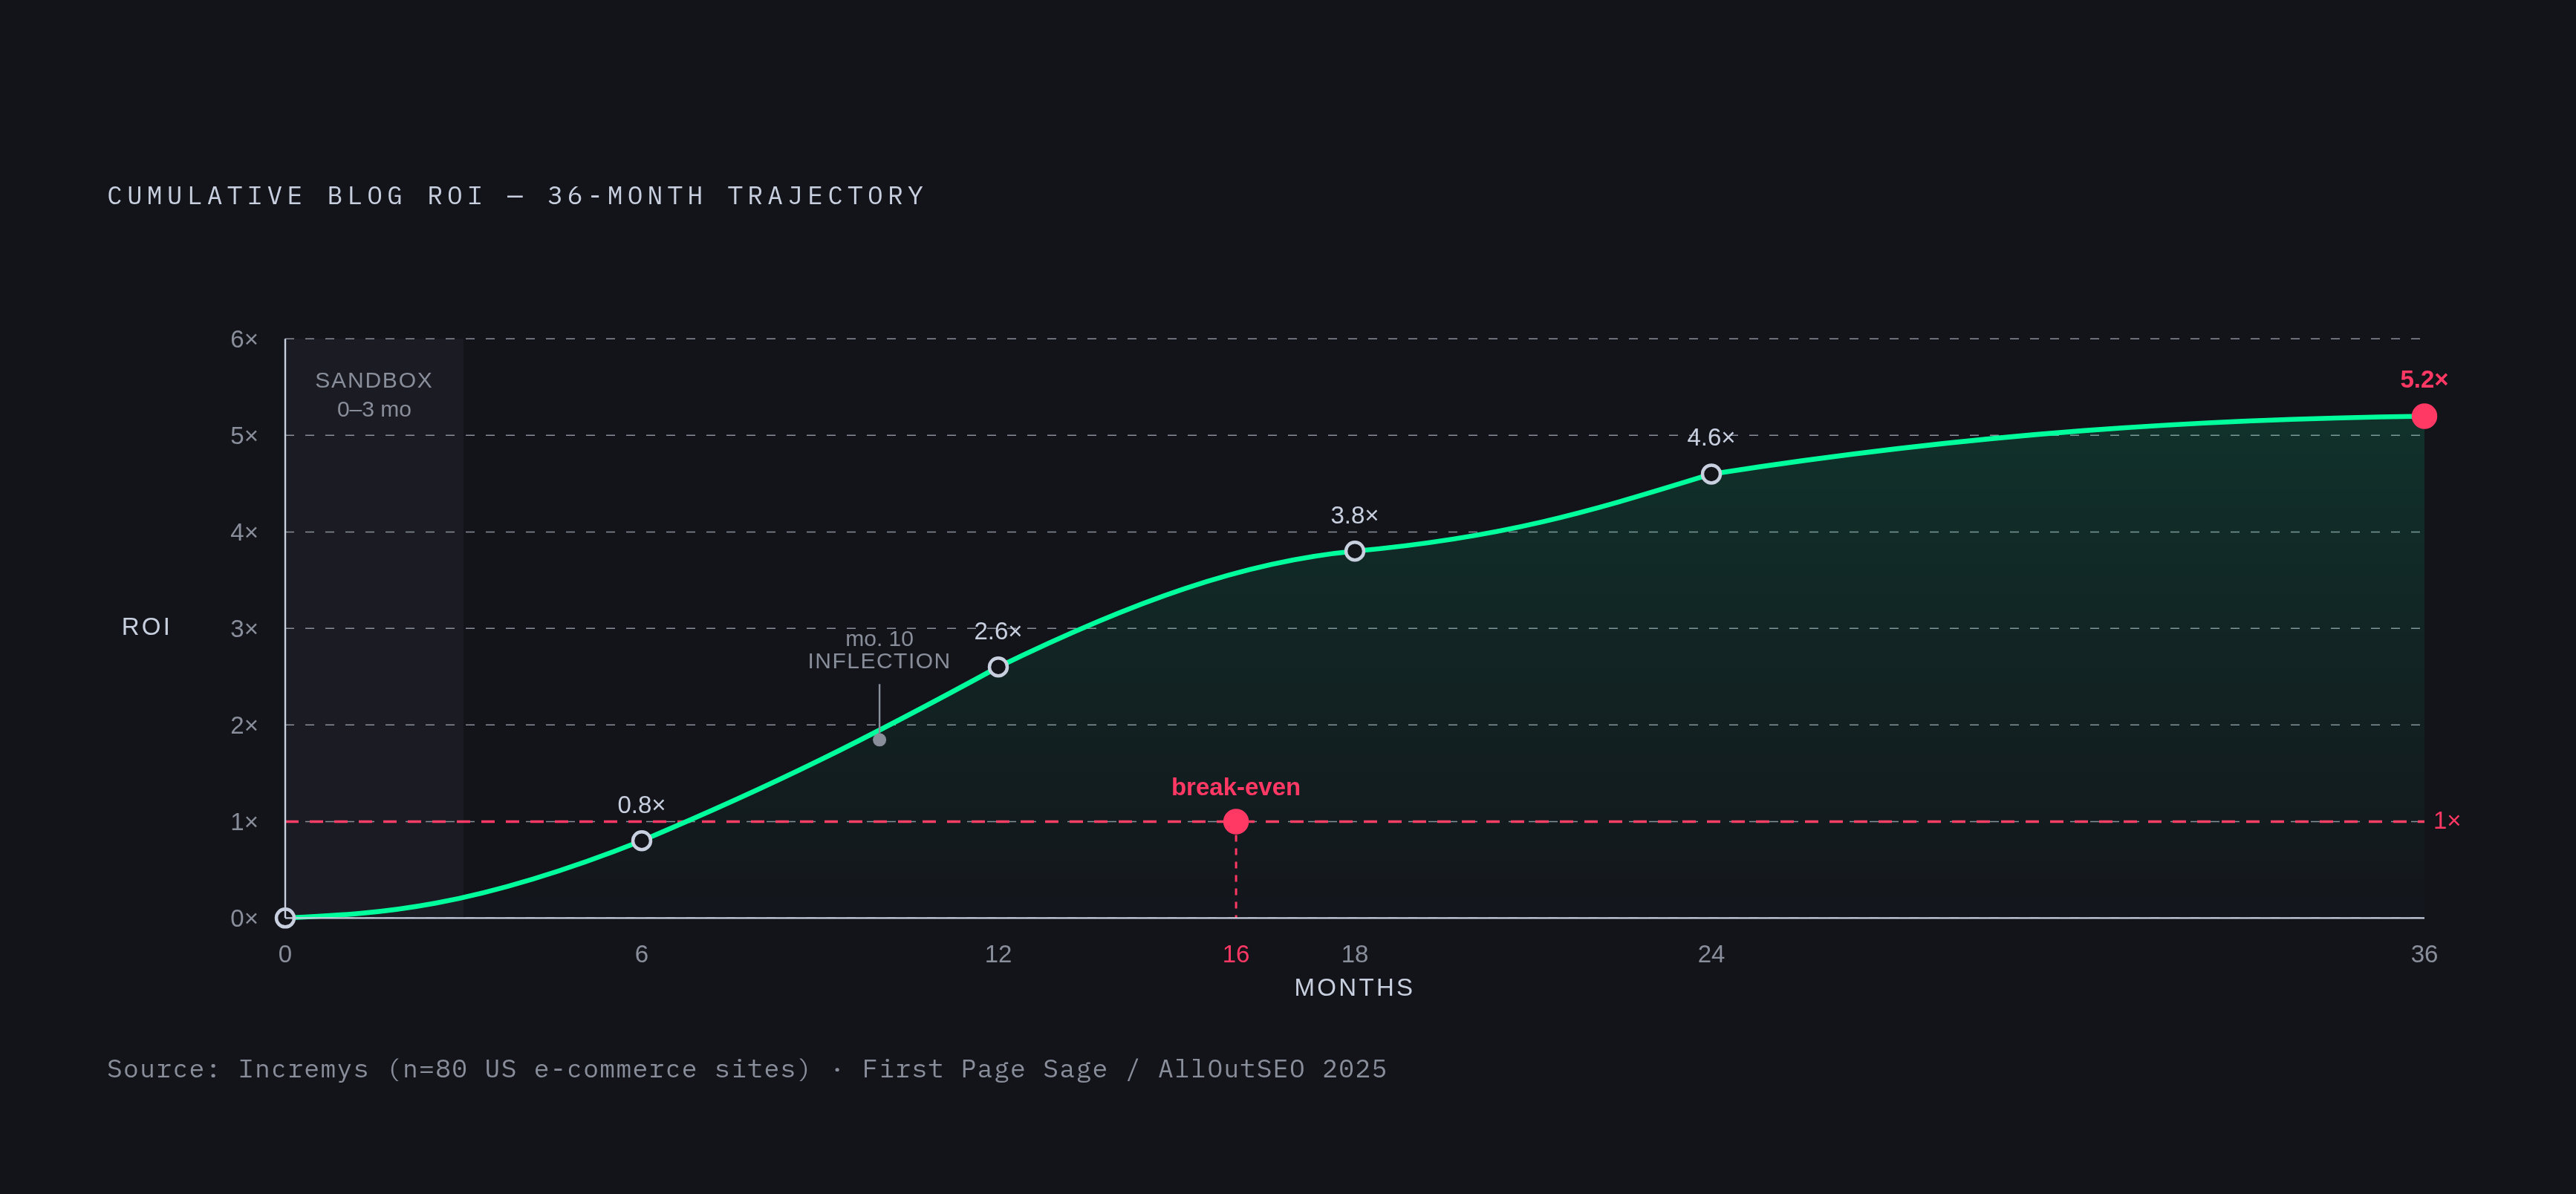
The odds of early success are lower than most people assume walking in. Only 5.7% of pages reach the top ten for their primary keyword within the first year, and for high-volume keywords specifically, that number drops below 1%, per 2025 Ahrefs data cited by WP SEO AI. Incremys studied 80 US e-commerce sites and found ROI progressing like this: 0.8x at six months, 2.6x at twelve months, 3.8x at eighteen months, 4.6x at twenty-four months, 5.2x at thirty-six months and beyond. First Page Sage, cited by AllOutSEO in 2025, puts the average break-even point at roughly sixteen months from launch. That's well past what most quarterly planning cycles are built to tolerate.
The fix is a ramp factor built straight into the model: near-zero return in months one through three, partial output in months four through nine, and the full projected monthly figure only from month ten or twelve onward. That gives you a realistic cumulative Year 1 number instead of the rookie move of multiplying the monthly projection by twelve and calling it a forecast. And if the domain itself is under twelve months old when the project starts, tack on another two to three months to every estimate above. Young domains earn trust slower, and no volume of content speeds that up.
Putting the full model together into a two-scenario forecast
A single number is a false-precision problem. Handing a stakeholder one figure, "$7,200 a month," implies a confidence the model doesn't actually have, given how many estimates are stacked on top of each other to produce it. The honest output is a range, not a point.
Build a conservative scenario using position 5 to 10 CTR figures, the full AI Overview adjustment (that 58% reduction on affected queries), a 1% conversion rate, and the ramp factor spread across twelve months. Build an optimistic scenario using position 3 CTR (around 10.2%), no AI Overview drag, a 2 to 3% conversion rate, and a compressed nine-month ramp that assumes strong cluster execution and some early link acquisition. Run the formula separately for each keyword cluster, then sum the results. This step matters more than it looks: it shows which clusters are actually carrying the model and which ones are along for the ride.
Layer the cost side back in. Take your total twelve-month investment, using the earlier benchmarks, and divide it into projected return under each scenario. That gives you an ROI range instead of one misleading figure that somebody will inevitably screenshot and treat as a promise.
What does a realistic Year 1 actually look like for a blog running $2,000 to $5,000 a month? Months one through three bring effectively zero organic return, the sandbox period doing its thing. Months four through nine, early traffic trickles in, sub-1x ROI, leads showing up in small volume. Months ten through sixteen, you approach break-even, and if content quality and link building stayed on track, compounding starts kicking in around here. Running the traffic-value framing alongside this, what equivalent paid traffic would've cost, gives you a second story to tell internally when the organic leads haven't fully materialized but the trend line is moving the right way.
None of this is a guarantee, and it shouldn't be dressed up as one. It's a structured bet: here are the inputs we're betting on, here's the timeline we're working against, here's where we check whether the thing is tracking with reality or not.
The metrics to track monthly so the model stays honest after launch
A forecast nobody checks against real numbers just stays a forecast forever; it never becomes a tool. So once the blog is live, the model needs monthly upkeep, not an annual glance-over.
Track impressions and average position for your target keywords first; that tells you whether you're climbing toward the CTR assumptions you modeled or stuck below them. Track actual CTR against your projected figure for each position band. If real CTR is running well below the position-based benchmarks, that's often a sign AI Overviews are eating more of your queries than the model accounted for. Track conversion rate against whatever you defined as "conversion" back when you set the input, and don't let that definition drift halfway through the year. Track the traffic ramp itself against the sandbox-period expectations: are you still near zero at month four when the model assumed partial traffic by then? That's a flag, not a footnote.
Also watch which clusters are outperforming their conservative scenario and which are underperforming even the pessimistic one. That comparison tells you where to shift content investment next quarter, and it's the best defense against a model that quietly goes stale while everyone keeps assuming it's still accurate. The formula got you a forecast; the monthly check is what keeps it honest.